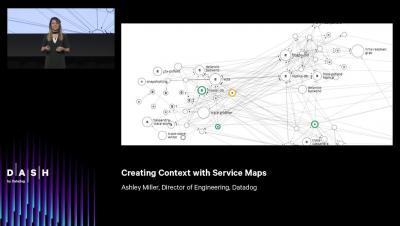
Operations | Monitoring | ITSM | DevOps | Cloud

Datadog

Collecting metrics with IIS monitoring tools

In this post, we’ll show you how to use built-in IIS monitoring tools to access and graph performance counters, configure logging in IIS, and query your logs with Microsoft’s Log Parser Studio. We’ll also explain how to use a diagnostic tool to investigate memory leaks and high CPU utilization in your application pools and worker processes.

Key IIS metrics to monitor

Microsoft’s Internet Information Services (IIS) is a web server that has traditionally come bundled with Windows (e.g., versions 5.0, 6.0, and beyond). IIS has numerous extensibility features. Swappable interfaces like ISAPI and FastCGI make it possible to use IIS with a variety of backend technologies, from micro-frameworks like Flask to runtimes like Node.js, along with technologies you’d expect to find within a Windows-based production environment (e.g., ASP.NET).

Accelerating Incident Response With Real-Time Business Data at Wayfair

Like any good e-commerce company, Wayfair collects a significant amount of data to use for business intelligence. Until recently, the majority of this data was crunched off-hours in preparation for business use the next day. We also create a great deal of data about our applications and infrastructure in real time.

Volunteers, Not Conscripts: Fixing Out-Of-Hours On-Call at Intercom

Uptime matters. At Intercom, we believe that keeping our product online and working well at all times is critical to the success of our business. Out-of-hours on-call is inherently disruptive to your life as an engineer. You need to be ready to respond quickly and competently to an alert about something being broken.