Operations | Monitoring | ITSM | DevOps | Cloud
Debugging
Testing and debugging websites and web apps on mobile devices can be challenging. Browsers on phones and tablets often don’t have built-in debuggers, and emulating mobile devices is never as accurate as you’d like. To debug mobile websites on Android, the desktop version of Chrome provides a solution with remote debugging. This article will show you how to use remote debugging with Chrome from your computer. You can use one of the common desktop operating systems like Windows, macOS, or Linux.
Debug JavaScript in Internet Explorer 11 in 7 easy steps
This article will focus on debugging JavaScript code within Internet Explorer 11’s Developer Tools. The developer tools built into IE11 make developing and debugging code in the browser relatively straightforward. The browser’s tools boast many of the features of the other more developer-focused browsers such as Chrome and Firefox.
JFrog & Lightrun Webinar: Continuous Observability & Continuous Debugging
Join JFrog’s Baruch Sadogursky and Lightrun’s Tom Granot as they investigate how high-performing engineering teams remain agile throughout the entire software production lifecycle, from development through deployment and all the way to observing and maintaining high-quality production systems at scale.
Lightrun & JFrog - Achieving Complete Agility With Continuous Debugging And Continuous Observability
CI/CD has become the de facto standard for infusing the software development process with hardcoded agility. Organizations are now integrating DevOps concepts and practices into their workflows in order to get great features out of the door faster and reduce internal friction. But your ability to understand what’s going on in a production service is pre-defined by the logs, metrics and traces (i.e. the three pillars of observability) your developers pre-defined during development. There is, however, a need for agility even after the service is live - in order to adhere to strict SLAs, decrease MTTR and save on logging costs.
Memfault: End-to-End Firmware Management
Memfault is a firmware technology platform designed to help hardware teams ship better products, faster. Memfault takes out the guesswork and allows engineering and support teams to instantly identify an issue, root cause it with hard data, and publish a fix.
Honeycomb Learn Ep 1 Instrument Better for a Happy Debugging Team
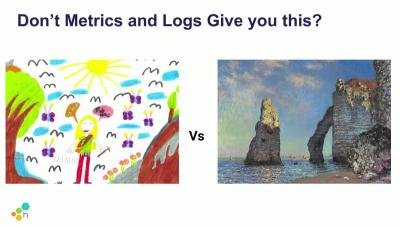
Nathan LeClaire, Sales Engineer @honeycombio knows first-hand that the key to instrumenting code is to start with baby steps. With Honeycomb, a little instrumentation will give vast insights as soon as you ingest your data. With Honeycomb Beelines, we take the heavy lifting out of instrumenting. Listen to learn: See Honeycomb in action, hear best practices, and learn how fast and painless instrumentation can be.
Honeycomb Learn Ep. 2: De-stress Debugging -Triggers, Feature Flags, & Fast Query
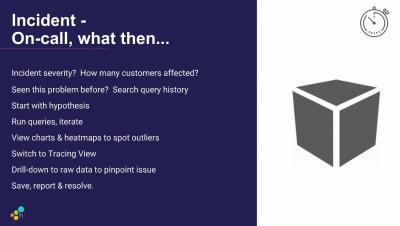
This episode in our Honeycomb Learn series looks at how to cut stress levels when debugging issues in production. Starting with a hypothesis, run fast queries, and then navigate to the code where the problem lies. Be proactive and set triggers to let you know if something needs attention. When engineering is about to ship a new release, set a feature flag to watch how production behaves in real-time. Curtail performance issues and reduce customer impact with the right tools to better understand production systems, right now.
Hard-Won Lessons Building Maintainable Web Applications
I’ve built web applications for 15 years. Some have succeeded and flourished, others have crashed and burned. But I’ve learned some hard-won lessons along the way: techniques that correlate with maintainable code and long-term success. Maybe they can help you.
Debug errors in Lambda functions
Troubleshooting production issues in Lambda environments is often challenging. CloudWatch requires developers to comb through logs, search for relevant terms that they may not always know of and has hard-to-consume stack traces. For obvious reasons, we recommend using Sentry to instrument your Lambda Functions code in order to report error stack traces and associated debugging context. Here’s a walk through on how to instrument a Node function.
ChartCenter Walkthrough with Rookout
Do you know how to use a chart repository for hosting and sharing Helm Charts? In this video, Rookout's walks us through JFrog’s ChartCenter, and shows us how to add a repository. ChartCenter is a free chart repository which makes it easy for the development community to upload and share charts with other developers.


