Operations | Monitoring | ITSM | DevOps | Cloud

Debugging

Practical Zephyr - Devicetree practice (Part 5)

In the previous articles, we covered Devicetree in great detail: We’ve seen how we can create our own nodes, we’ve seen the supported property types, we know what bindings are, and we’ve seen how to access the Devicetree using Zephyr’s devicetree.h API. In this fifth article of the Practical Zephyr series, we’ll look at how Devicetree is used in practice by dissecting the Blinky application.

Mastering Live Debugging Techniques: A Must-Have Guide for Developers

Software debugging has undergone many transcendental shifts. These shifts are as fascinating as the transition from the biological origins of the term ‘debugging’ to its computer science incarnation. The moth that caused the first computer bug has led to a metamorphosis of the debugging scope to cover a much broader role in software development over the years. Live debugging is the latest manifestation of this evolution.

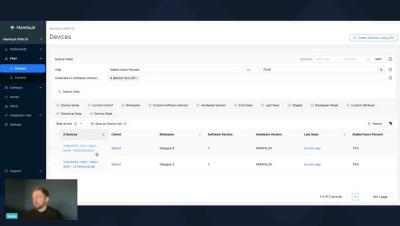
Embedded Device Observability data collected via Bluetooth Low Energy - Blecon and Memfault demo

In this demo we show an example of how Memfault's Observability solution can work seamlessly with Blecon's Bluetooth technology to get devices connected and sending data to the cloud with ease. In this case the device is running a Nordic nRF52.

Diving into JTAG - BSDL (Part 4)

In the previous article of this series, we briefly touched on how.bsd files written in Boundary Scan Description Language (BSDL) describe the structure of the boundary scan chain and the instruction set. In this article, we will examine this language’s syntax more closely before seeing how.bsd files are leveraged in JTAG testing in the next article.

Frontend Debugging Is Bad and it Should Feel Bad

There’s a sentence that strikes fear into the heart of every frontend developer I've ever met: Users are reporting issues, and we don't know how to replicate them. What do you do when that happens? Do you cry? Do you mark the issue as wontfix and move on? Personally, I took the road less traveled: gave up frontend engineering and moved into product management (this is not actually accurate but it's a good joke and it feels truthy).

Five improvements to Make Debugging Less Terrible

Over the past year, we released a couple of new offerings, like Session Replay and Cron Monitoring. But in addition to building new products, we’re constantly looking for ways to improve our core platform to help you debug software issues faster. As you hopefully saw during Sentry’s Launch Week, we shipped five quality-of-life improvements addressing the following problems: Here’s the latest.

Diving into JTAG - Debugging (Part 3)

In the third installment of this JTAG deep dive series, we will talk in-depth about JTAG Boundary-Scan, a method used to test interconnects on PCBs and internal IC sub-blocks. It is defined in the IEEE 1149.1 standard. I recommend reading Part 1 & Part 2 of the series to get a good background on debugging with JTAG before jumping into this one!

Simplify production debugging with Datadog Exception Replay

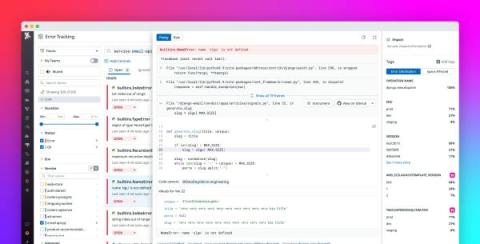
Debugging errors in production environments can frustrate your team and disrupt your development cycle. Once error tracking detects an exception, you then need to identify which specific line of code or module is responsible for the error. Without access to the inputs and associated states that caused the errors, reproducing them to find the root cause and a solution can be a lengthy and challenging process.