Sentry

San Francisco, CA, USA
2011
  |  By Salma Alam-Naylor
Minifying your CSS helps improve your website performance. But as developers, we don’t really talk about minifying CSS anymore. Why? The TL;DR is that the delivery and optimization of CSS have both been improved with modern tech stacks, making it practically a non-issue. The efficient and performant delivery of CSS is largely solved by HTTP/2 and modern compression algorithms, whilst modern front end frameworks take care of the boring optimization jobs such as code-splitting and minification.
  |  By Salma Alam-Naylor
Cumulative Layout Shift (CLS) is where the layout of a web page unexpectedly shifts after the initial content loads and new content pops in. At its best, it’s a little inconvenient. At its worst, it’s an accidental click of a “BUY NOW” button that suddenly appeared under your mouse cursor after an ad loaded, resulting in an unwanted purchase.
  |  By Ben Peven
It’s the little things that can make a big difference. While we announced significant product updates like Autofix and Metrics (to name a few) during Launch Week, we couldn’t cover everything. Over the past few months, we shipped updates to the core platform, improvements to the developer workflow, and a series of quality-of-life features. The sum of these small improvements add up to big updates across Sentry that help make your production issues even more debuggable.
  |  By Steven Eubank
When cloud service providers first started popping up, many developers were “wowed” by being able to spin up and scale all kinds of infrastructure to deploy their web applications on demand. However, big-box cloud service providers are often complex to use, scaling out is expensive and default monitoring solutions are not very insightful. Besides, we are spoiled developers, and we expect things to be easy.
  |  By Salma Alam-Naylor
Recently, I improved all my homepage Core Web Vitals by focusing on improving just one metric: the Time to First Byte (TTFB). All it took was two small changes to how data is fetched to reduce the p75 TTFB from 3.46s to just 704ms. In this post I’ll explain how I found the issues, what I did to fix them, and the important decisions I made along the way. (And don’t worry, I’ll break down “p75” and “TTFB”, too!)
  |  By Jonas Badalic
On March 12 Google began promoting INP (Interaction to Next Paint) into a Core Web Vital metric in an effort to push performance beyond page loads. This means your website or application’s SEO ranking may be impacted if users do not have smooth interactions on the site or app. While this change is a net positive for users, finding the root cause of these reported slow interactions can be tricky for developers.
  |  By Lazar Nikolov
“A picture is worth a thousand words”. So if a picture takes more than 4 seconds to load, does it mean that your website’s content fails to communicate a thousand words? In this blog post, we’ll learn how to identify unoptimized images, how to fix them, and how to validate the fix — so your website can speak volumes with highly-optimized images.
  |  By Angela Jiang
Over the past year, we released a couple of new offerings, like Session Replay and Cron Monitoring. But in addition to building new products, we’re constantly looking for ways to improve our core platform to help you debug software issues faster. As you hopefully saw during Sentry’s Launch Week, we shipped five quality-of-life improvements addressing the following problems: Here’s the latest.
  |  By Cassandra Gatton
While there are several solutions that try to help you improve your testing practices and tooling, we believe that high-quality software is not just limited to how well it’s tested. That’s why we’re expanding beyond code coverage and building the foundation for the first of its kind pre-release platform with Bundle Analysis, Test Analytics, and AI-Powered Code Review.
  |  By Tillman Elser
We’ve been exploring new approaches to make Sentry issues more actionable. Read on to learn how we’re using machine learning to improve issue creation (i.e. grouping) and alerts, with as little configuration as possible, so you can focus on fixing the most important issues.
  |  By Sentry
See why 4M developers consider Sentry “not bad”. Get the context you need when your code breaks. See the environment, OS, device, and commit that introduced an error, and what’s causing slowdowns in your application, down to the broken line of code.
  |  By Sentry
EU Data Residency is here. Available to all customers— no matter the pricing tier.
  |  By Sentry
In this customer workshop, David Winterbottom, principal software engineer at Kraken Technologies, shared an inside look into how he and his team develop, deploy, and maintain a rapidly evolving Python monorepo with over 4 million lines of code that powers the Kraken utility platform.
  |  By Sentry
Learn the difference between Sentry Error Monitoring and traditional logging. TL;DR - Sentry surfaces the most important information related to debugging errors in your project, while logging includes everything, not just information related to errors.
  |  By Sentry
Don’t let your scheduled jobs miss a beat. If you regularly run jobs like data backups, system updates or invoice processing, Sentry Cron Monitoring will tell you when and why a scheduled job fails and trace it back to related errors in your project. Visit the link below to learn more.
  |  By Sentry
In this demo, follow along to integrate Sentry with GitHub and set up code mappings. See how connect Sentry to GitHub so you can view your source code within your stack trace.
  |  By Sentry
In this demo, learn how to integrate Sentry with Slack, so your team knows about issues as soon as they happen.
  |  By Sentry

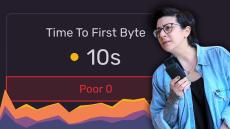
Check out the blog post for more:
https://bit.ly/fix-brutal-ttfb

  |  By Sentry
Today, Sentry metrics in beta and free to use – eligible users will now see Metrics in their Sentry accounts. This isn’t just another tool; it’s your new best friend for tracking the data points that matter most to you over time. With Metrics, you can pinpoint and resolve issues with correlated traces, ensuring your product/service/code is always running as intended.

Open-source error tracking that helps developers monitor and fix crashes in real time. Iterate continuously. Boost efficiency. Improve user experience.

Sentry provides open source error tracking that gives you insight into every crash in your stack as it happens, with the details needed to prioritize, identify, reproduce, and fix each issue. Sentry supports all popular languages and platforms, and offers a perspective that enables you to see which errors are doing the most harm to your business and help you understand how issues affect your bottom line.

Find out about exceptions right away. Set up Sentry in minutes with just a few lines of code. Get notifications via email, SMS, or chat as part of an existing workflow when errors occur or resurface.

Quickly find and fix production errors. Triage, reproduce, and resolve errors with max efficiency and visibility. Exception handling with Sentry helps developers build better apps and iterate faster.

See the impact of each release. Integrate error tracking with your commit and deploy workflows. Aggregate events to see where bugs happen, how often, and who's affected before users even notice.

Error tracking built for community. Sentry started as and remains a 100% open-source project, now delivered as a hosted service. Development aligns to security, observability, and production at scale.

Users and logs provide clues. Sentry provides answers.