Operations | Monitoring | ITSM | DevOps | Cloud

Debugging

Debugging Java Equals and Hashcode Performance in Production

I wrote a lot about the performance metrics of the equals method and hash code in this article. There are many nuances that can lead to performance problems in those methods. The problem is that some of those things can be well hidden. To summarize the core problem: the hashcode method is central to the java collection API. Specifically, with the performance of hash tables (specifically the Map interface hash table). The same is true with the equals method.

Debugging Race Conditions in Production

Race conditions can occur when a multithreaded application accesses a shared resource using over one thread. Unless we have guards in place, the result might depend on which thread “got there first”. This is especially problematic when the state is changed externally. A race can cause more than just incorrect behavior. It can enable a security vulnerability when the resource in question can be corrupted in the right way. A good example of race condition vulnerabilities is mangling memory.

KoolKits - Highly-opinionated, batteries-included Kubernetes debugging toolkits

KoolKits (Kubernetes toolkits) are language-specific container images that contain a (highly-opinionated) set of tools for debugging applications running in Kubernetes pods. You can read more about the motivation behind this project here. Those images are intended for use with the new kubectl debug feature, which spins up Ephemeral containers for interactive troubleshooting. A KoolKit will be pulled by kubectl debug, spun up as a container in your pod, and have the ability to access the same process namespace as your original container.

Proactive Debugging with Offensive Programming

When bugs inevitably make their way into production firmware, defensive programming practices give you peace of mind that your devices will keep running despite issues occurring in the background. However, defensive programming can lead to more issues than it solves if not used carefully. Often the better approach to take is to use the practice of offensive programming, which will help surface issues more quickly and easily and help you iterate towards bug-free firmware and a better overall product experience.

Nash's Four Favorite Firmware Debug Tools

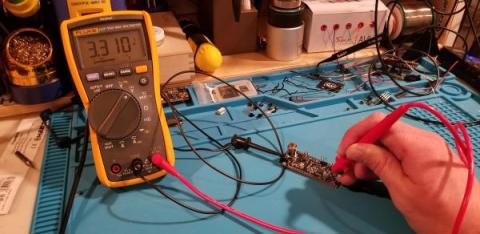
As much as I enjoy writing firmware, I am, at heart, a hardware engineer. I love hunting for minutia in chip datasheets. I love fiddling with eval boards, tacking on wires, and reworking nets together. I love flipping through The Art of Electronics, finding a new circuit, and piecing through its operation. This is why, when invited to write for Interrupt, I jumped at the chance to write about a hardware-related topic that’s near and dear to my heart: debug tools.

Tracing & Logging with the `TRICE` Library (Interrupts too!)

If you develop software for an embedded system, you need some kind of system feedback. Debuggers are awesome tools, but when it comes to analyzing dynamic behavior in the field, they cannot be used. For remote debugging, many engineers turn to printf, which can usually be quickly put in place after having a putchar() implemented. This turns out to be an expensive way, in terms of processor clocks and required FLASH memory for the strings.

Debug source code in real time with Rookout's Datadog App

Earlier this year we launched Datadog Apps, which seamlessly integrate functionality from third-party tools into Datadog’s centralized monitoring platform. This project has enabled us to collaborate with some of our partners, such as PagerDuty and LaunchDarkly, to extend the Datadog UI and provide our customers with new solutions for incident management, feature flag optimization, and more.