Operations | Monitoring | ITSM | DevOps | Cloud
Debugging
Building more reliable Bluetooth LE products with Memfault
Using SWIG to generate bindings between C and Lua
Lua is one of the many great interpreters that can be run on embedded devices. It’s fast, uses little memory, is written in ANSI C, and is known by plenty of developers. These are a few of the many reasons why the team at Panic chose to include a Lua interpreter on their Playdate device and allow games to be written in it. You can think of Lua as an alternative to the MicroPython (Python) or JerryScript (Javascript) interpreters. However, there’s a problem.
Monitoring Your Fleet With Memfault Training
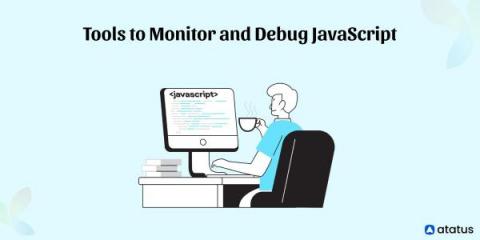
11 Best Tools to Monitor and Debug JavaScript in 2023
JavaScript is one of the most widely used programming languages for creating dynamic, interactive websites. However, there may be instances where a function is not operating as intended because of a coding error while creating JavaScript projects. Therefore, the majority of developers hunt for JavaScript debugging tools to avoid problems and identify errors before execution.
The Power of Metrics - Monitoring Battery Life, Connectivity, Power Consumption & More
OTA Updates & Management with Memfault
Memfault 101 Training
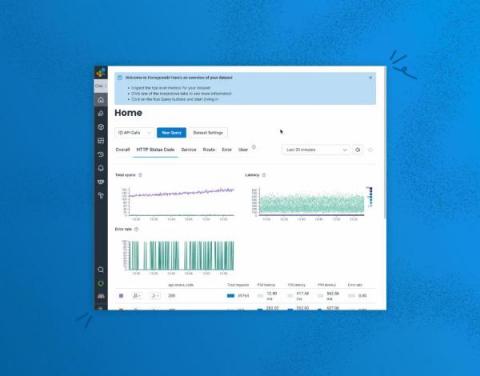
Debugging Just Got Faster and Easier With New Enhancements to BubbleUp
BubbleUp is Honeycomb’s machine-assisted debugging feature and is one of our most powerful differentiators. It leverages machine analysis to cycle through all of the attributes found in billions of rows of telemetry to surface what is in common with problematic data compared to baseline data. This explains the context of anomalous code behavior by surfacing exactly what changed when you don’t know which attributes to examine or index, dramatically accelerating the debugging process.
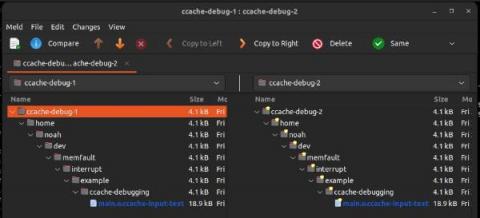
Pocket article: Debugging ccache misses
This article provides a few tips and tricks for diagnosing ccache misses, to keep your C/C++ build nice and snappy!


