Operations | Monitoring | ITSM | DevOps | Cloud
Latest News
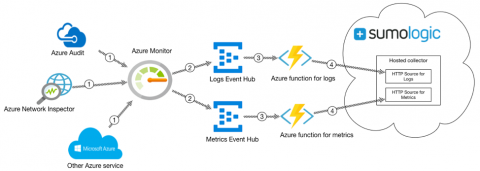
How to Monitor Azure Services with Sumo Logic
This week at the Microsoft Ignite, we unveiled two new Sumo Logic applications for Microsoft Azure services — Azure SQL Database and Azure Active Directory — and two new native integrations with Azure Monitor and Blob Storage. As a cloud-native company, our goal at Sumo Logic is to give our customers the flexibility to create digital IT and DevOps initiatives that leverage multi-cloud deployments in Amazon Web Services (AWS), Google Cloud Platform (GCP) and Microsoft Azure.
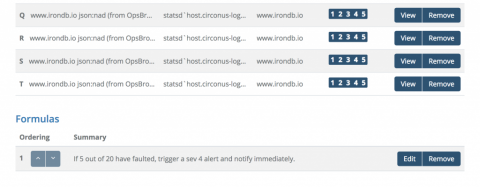
Quantifying WordPress Performance Improvements with circonus-logwatch
Deriving meaningful insights from third-party logs has always been a difficult yet necessary task. Most analysis occurs after-the-fact, when something has gone wrong. Very few tools allow real-time monitoring of logs, so SREs have become accustomed to backfilling log data into various analysis tools. Postmortem log analysis is the de facto standard, yet should it be? Why shouldn’t you be able to monitor your server logs in real-time?
Honeycomb vs Elastic Stack: It's about priorities
If you’ve been paying attention, you know that although collecting and reviewing metrics and logs is a core part of running a stable and successful service, access to raw events and the ability to search and pivot on any dimension of your production environment, no matter how high-cardinality, is what will help your team debug and troubleshoot new problems and outages more quickly.
Log analytics and dashboarding in Datadog
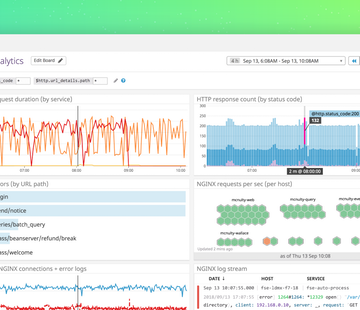
Achieving optimal performance can be challenging when you depend on separate platforms to monitor service health and to manage your logs. When data about your systems is spread across multiple platforms, investigating issues—and ultimately resolving them—takes longer and requires expertise with more tools. It takes more effort to identify real customer impact, as well as to verify that your responses to an incident are having the desired effect.
Announcing the Sumo Logic Global Intelligence Service at Illuminate 2018
In today’s hyper-connected world, a company’s differentiation is completely dependent upon delivering a better customer experience, at scale, and at a lower cost than the competition. This is no easy feat, and involves a combination of many things, particularly adopting new technologies and architectures, as well as making better use of data and analytics.
Sumo Logic's Third Annual State of Modern Apps and DevSecOps in the Cloud Report is Here!
Imagine that you are tasked with architecting your mission-critical cloud application. Or migrating your on-premises app to the cloud. And you ask yourself “how do the cloud savvy companies like Twitter, Airbnb, Adobe, SalesForce, etc. build and manage their modern applications?”
Live Tailing Parsed Logs in Logz.io
Last year we introduced Live Tail — the ability to see a live feed of all the logs in your system, in real time, within Kibana. This ability to see a live stream of logs as they are being outputted from the different processes in a monitored environment was a greatly requested feature, and since being introduced we have received some excellent feedback from users that has allowed us to improve the basic functionality of Live Tail.
Logstash Tutorial: A Quick Getting Started Guide
Looking to learn about Logstash as quickly as possible? This article is for you: we’ll install Logstash and push some Apache logs to Elasticsearch in less than 5 minutes.
How to collect, customize, and manage Rails application logs
Logging is an important part of understanding the behavior of your applications. Your logs contain essential records of application operations including database queries, server requests, and errors. With proper logging, you always have comprehensive, context-rich insights into application usage and performance. In this post, we’ll walk through logging options for Rails applications and look at some best practices for creating informative logs.


