Operations | Monitoring | ITSM | DevOps | Cloud

Latest Posts

Prometheus for multi-cluster setups

This tip is for those who are using Prometheus federation to monitor multiple clusters. How should alertmanager be configured for multiple clusters? Let us say that if there’s an issue for Cluster A it only needs to send an alert for cluster A? In such cases, every alert should be routed to proper team based on labels (if there is problem with application A on cluster B - team responsible should be notified). In the above case, two alerts are triggered by the same rule.

Trust-building elements to increase conversion rates

In order to have a pipeline with great conversion rates, one must integrate a number of design and copy updates into your application funnel for trust-building and user empowerment. These are also called service evidence, a term comes from The Design of Everyday Things by Don Norman.

Using context to triage change-triggered incidents

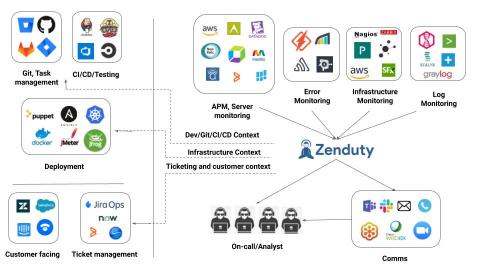
One of the first things incident managers do when they get an alert page from Zenduty is to check the “Context” tab of the incident. Incident context is extremely critical to get a first responder’s view of what happened and what could possibly have caused it. Context tells you what happened before an incident. In the case of 40–50% of all incidents, Zenduty’s incident context can tell you within 5–10 seconds, what could be the cause of an incident.

Real-time alerts from Zabbix and escalation with Zenduty

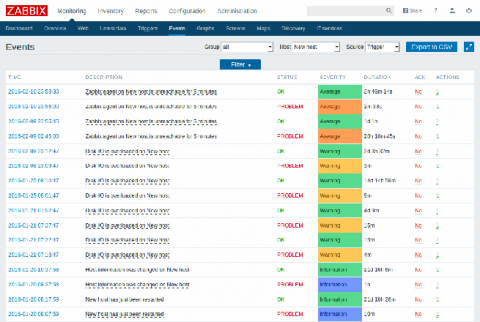
Recently, one of our customers, a 20-member NOC team of a large B2C company, had set up Zabbix to monitor a network of over 1000+ servers, routers, and switches. The NOC team wanted to set up alerting, on-call scheduling, and an escalation matrix whenever a critical network component encountered any downtime. The NOC team used Slack as the primary communication channel and Zoom for real-time communication. For NOC teams like these running a very large operation, setting up alerting can be very tricky.

Accelerating your Zendesk customer support response times by 50% and meeting support SLAs

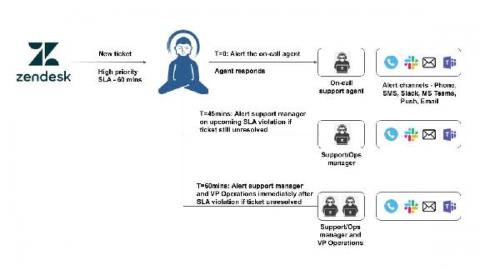
Zendesk is one of the most popular ticketing support and customer service platforms available in the market. Two metrics that measure the effectiveness of your customer support are the response and resolution times — how soon are you able to respond to a customer ticket, and how soon are you able to mobilize relevant personnel, perform necessary remediation tasks and finally resolve the ticket.

Monitoring service health and downtime events within your Google Cloud with Zenduty

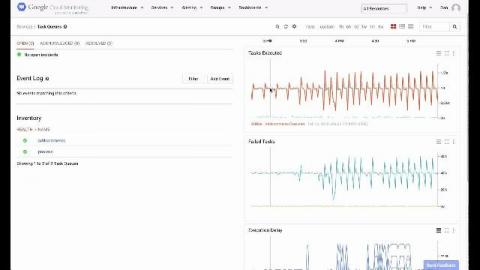
Google Cloud Platform (GCP) is a collection of Google’s computing resources, made available via services to the general public as a public cloud offering. The GCP resources consist of physical hardware infrastructure — computers, hard disk drives, solid-state drives, and networking — contained within Google’s globally distributed data centers, where any of the components are custom designed using patterns similar to those available in the Open Compute Project.

Sending Azure Monitor outage notifications to Microsoft Teams

Microsoft Azure is a cloud computing service providing infrastructure as a service (IaaS), software as a service (SaaS) and platform as a service (PaaS) supporting multiple Microsoft Specific and third-party services and systems with 90+ compliance offerings and trusted by 95% of Fortune 500 companies to base their business on. What is a system downtime and how does it affect me or my business?

Azure service health alerts and escalation with Zenduty

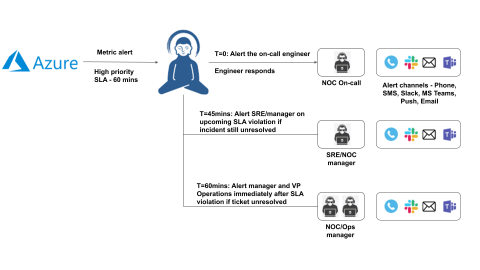
Microsoft Azure is a cloud computing service providing infrastructure as a service (IaaS), software as a service (SaaS) and platform as a service (PaaS) supporting multiple Microsoft Specific and third-party services and systems with 90+ compliance offerings and trusted by 95% of Fortune 500 companies to base their business on. What is a system downtime and how does it affect me or my business?

Grafana alerts and incident escalation with Zenduty

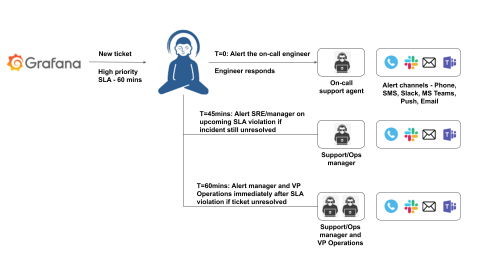
Grafana is one of the most popular open-source visualization tools that can be used on top of a variety of different data stores but is most commonly used together with Graphite, InfluxDB, Prometheus, Elasticsearch, Prometheus, AWS CloudWatch, and many others. Reliability engineers use Grafana is its ability to bring together several data sources together in a unified dashboard and increase the observability of your production systems.

Meeting customer support SLAs on Freshdesk using proactive alerting and escalations with Zenduty

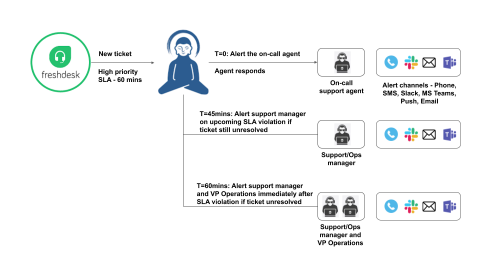
As businesses close more deals and add more accounts, it is still imperative for businesses to maintain their SLA levels and resolve customer support tickets within SLA timeframes. Having a solid support team is great, but supporting hundreds or thousands of users in the most efficient, cost-effective way while maintaining SLAs continues to be a challenge for the majority of companies. An SLA policy ( service level agreement) lets you set standards of performance for your support team.