








Santa Barbara, CA, USA
2007
  |  By LogicMonitor
See how packet-level and DevTools throttling produce different performance results, and learn which method reveals the network costs that slow your pages.
  |  By LogicMonitor
See how a Google Cloud outage took major brands like Home Depot offline, and why digital experience monitoring spots failures before status pages update.
  |  By LogicMonitor
See how BGP announcements, replacements, and withdrawals shift reachability across networks you don’t own, and why outside-in monitoring catches them.
  |  By LogicMonitor
See how DNS turns a domain name into an IP address step by step, and why fast resolution keeps your pages loading quickly for users all around the world.
  |  By LogicMonitor
Correlate internal infrastructure health with Internet-path data to localize WAN slowdowns fast across MPLS, SD-WAN, and direct Internet access at the branch.
  |  By LogicMonitor
Cut alert fatigue and resolve incidents faster. Learn how to design tests, route alerts to the right owning team, and connect internal and Internet signals.
  |  By LogicMonitor
Incidents now unfold across more connected systems and at greater speed. Here’s what Forrester says IT leaders should rethink as AI takes a larger role in investigation, response, and recovery.
  |  By LogicMonitor
AI dashboards use artificial intelligence to surface relevant metrics, generate visualizations, and add context to complex data. Learn how AI dashboards work, how they compare with traditional dashboards, and what they can mean for IT operations.
  |  By LogicMonitor
LogicMonitor and Work4Flow extend Edwin AI into ServiceNow with A2A, bringing alert context, metrics, root cause analysis, and diagnostic guidance into the incident workflow.
  |  By LogicMonitor
A provider outage ten days before Black Friday 2025 showed how exposed peak-season revenue can be. Here’s what downtime costs, how to estimate your own number, and the questions to ask your teams before traffic arrives.
  |  By LogicMonitor, Inc.
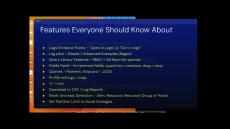
LM Logs troubleshooting starts at the alert. This Logs for Lunch session shows ITOps teams an alert-to-logs workflow and lesser-known LM Logs tips. Ryan Matuszewski demos a Tomcat application error. From the alert's Logs tab, he moves through log anomaly detection, All Logs, Log Patterns, and Log Analysis sorted by sentiment. He then opens the Logs page with the alert time range, and the same steps work for any alert type.
  |  By LogicMonitor, Inc.
Autonomous IT requires three things: complete, AI-ready data; connected context; and governed action. In LogicMonitor's 2H announcement, we show enterprise IT and ITOps leaders how each layer works. LogicMonitor is the AI-first platform for Autonomous IT. This update covers the three layers behind autonomous IT operations as the category moves from systems of intelligence to systems of action. Your team decides when Edwin AI moves from recommending an action to taking it.
  |  By LogicMonitor, Inc.
SNMP traps as logs, AI log anomaly detection, and network troubleshooting are the focus of Logs for Lunch: August 2026, for network and IT ops teams and LogicMonitor users. Tom Chavez introduces LM Logs, which keeps logs and metrics together. Cameron Compton troubleshoots dropped tunnel packets from a network operations dashboard, and Ron Scinta ingests SNMP traps through the Collector. Patrick Sites and Kerry DeVilbiss answer questions on load balancing, OTel and Cribl forwarding, MSP log sources, and search performance.
  |  By LogicMonitor, Inc.
Cloud log monitoring in LogicMonitor connects a service alert to the log event behind it. This Logs for Lunch July demo is for ITOps, CloudOps, and SRE teams. Tom Chavez hosts Ismath Mohideen (Product Marketing) and Nick Doane (Senior Sales Engineer). They cover cloud observability and multi-cloud monitoring across AWS, Azure, GCP, and OCI in LM Envision, using cloud provider APIs with no extra collectors.
  |  By LogicMonitor, Inc.
AI investigation for IT operations finds the likely root cause of an incident and shows the evidence behind it. This video covers how deep AI investigation works for ITOps, SRE, and platform engineering teams using LogicMonitor's Edwin AI. Engineers lose time stitching together alerts, logs, and recent changes after an alert fires. Deep AI investigation hands that first pass to AI agents, so your team starts closer to the fix. Edwin AI, LogicMonitor's AI agent for ITOps, correlates alerts, identifies root causes, and recommends remediation.
  |  By LogicMonitor, Inc.
Incident management fundamentals still apply, even as hybrid cloud and Kubernetes reshape incidents. Garrett Douglas joins LogicMonitor's Coffee and Context on why one failure floods ITOps with alerts and fuels alert fatigue. The bottleneck is incident context: knowing which alerts matter for incident response. Forrester's report Incident Management Has Outgrown Its Playbook frames context as the new competitive advantage.
  |  By LogicMonitor, Inc.
SCC replaced fragmented tooling, including Nagios, with unified observability the whole team can use. The session covers proactive monitoring, SLA protection, and serving more customers without adding headcount per account. It's made for MSP leaders exploring AIOps for MSPs and observability for MSPs.
  |  By LogicMonitor, Inc.
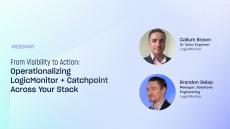
Internet performance monitoring (IPM) gives IT leaders, operations teams, and network engineers visibility into the ISPs, carriers, and SaaS services their business depends on but doesn't control. In this LogicMonitor and Catchpoint webinar, Callum Brown (presales, EMEA, LogicMonitor) and Brandon Dunlap (solution engineering, Catchpoint, a LogicMonitor company) show how to operationalize IPM, moving from visibility to control.
  |  By LogicMonitor, Inc.
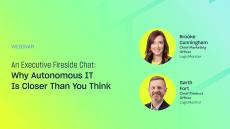
Autonomous IT is the focus of this LogicMonitor fireside chat with CMO Brooke Cunningham and CPO Garth Fort, built for enterprise IT leaders, IT operations, and observability and AIOps teams. Brooke and Garth break down the 2026 Observability and AI Outlook for IT Leaders report, based on a survey of 100+ VP-level IT leaders who own observability budgets across North America, EMEA, and Asia Pacific.
  |  By LogicMonitor, Inc.
AI incident response just got faster. Watch how LogicMonitor Edwin AI brings investigation, root cause analysis, and action directly into Slack for ITOps, SRE, DevOps, NOC, and incident response teams. When an incident hits, responders juggle monitoring tools, ITSM systems, dashboards, and documentation to find what they need. Edwin AI brings that context into Slack, so your team can investigate, decide, and act in one place.
  |  By LogicMonitor
Monitoring solutions need to do more than just provide visibility. They need to extract and deliver powerful business insight to drive results. The LogicMonitor solution does that. And it is fast, easy, SaaS-based and hybrid-capable!
  |  By LogicMonitor
The new book, "Preparing for Your Migration to the Cloud," written by LogicMonitor founder, Steve Francis, and published by O'Reilly Media, is the first comprehensive guide for businesses preparing for migration to the cloud.
  |  By LogicMonitor
Helping to protect the confidentiality of our customers' systems and data is of utmost importance to LogicMonitor, as is maintaining the trust and confidence of our customers.
  |  By LogicMonitor
Until recently, Hadoop deployments existed on hardware owned and run by organizations. Now, of course, you can acquire the computing resources and network connectivity to run Hadoop clusters in the cloud. But there's a lot more to deploying Hadoop to the public cloud than simply renting machines.
  |  By LogicMonitor
CloudWatch gives some valuable visibility into your AWS account and the resources running there. In any system of reasonable size and complexity, however, the limitations of CloudWatch will quickly become apparent.
  |  By LogicMonitor
Worldwide, enterprises are racing to digitally reinvent themselves. In fact, 85 percent of enterprise decision makers believe they have a timeframe of two years to make significant inroads on their digital transformation before suffering financially and/or falling behind their competitors.
  |  By LogicMonitor
The ease of use and scalability of AWS makes it incredibly easy to build out new infrastructure and experiment with new services, but also causes difficulties in managing spend. This white paper focuses on AWS cost optimization best practices essential for a successful cloud migration.
  |  By LogicMonitor
This white paper will provide best practices for alert tuning to ensure the following outcomes: monitoring is in place to catch critical conditions, the right people are alerted, the amount of noise is reduced, and people are not needlessly woken up.
  |  By LogicMonitor
This list explores how SaaS solutions leverage modern technology to keep up with and provide crucial visibility into today's dynamic infrastructures

LogicMonitor® is an automated, SaaS-based IT performance monitoring platform that provides the end-to-end visibility and actionable data needed to manage complex and agile IT environments. Our company is headquartered in Santa Barbara, California, with offices in Austin, Texas, London, China, and Singapore.

LogicMonitor provides hosted monitoring for the entire technology stack — storage, servers, networks, applications, virtualization, and cloud — in a single, unified solution. LogicMonitor includes built-in monitoring, alerting, and graphing for all devices found in the data center. LogicMonitor is changing the way IT infrastructure is monitored with its cloud-based, highly automated, and easy to deploy solution.

Automated hybrid infrastructure monitoring and analytics:

  • Deploy Faster: SaaS architecture, no hardware & automated device discovery
  • Monitor More: Pre-configured for on-premise, cloud, and hybrid IT infrastructure
  • Empower Ops: Consolidate tools; IT teams access same data and troubleshoot faster

One platform. Endless possibilities.