Operations | Monitoring | ITSM | DevOps | Cloud
Elastic
Mainframe Observability with Elastic and Kyndryl
As we navigate our fast-paced digital era, organizations across various industries are in constant pursuit of strategies for efficient monitoring, performance tuning, and continuous improvement of their services. Elastic® and Kyndryl have come together to offer a solution for Mainframe Observability, engineered with an emphasis on organizations that are heavily reliant on mainframes, including the financial services industry (FSI), healthcare, retail, and manufacturing sectors.
Custom Java Instrumentation with OpenTelemetry
IDC Market Perspective published on the Elastic AI Assistant
IDC published a Market Perspective report discussing implementations to leverage Generative AI. The report calls out the Elastic AI Assistant, its value, and the functionality it provides. Of the various AI Assistants launched across the industry, many of them have not been made available to the broader practitioner ecosystem and therefore have not been tested. With Elastic AI Assistant, we’ve scaled out of that trend to provide working capabilities now.
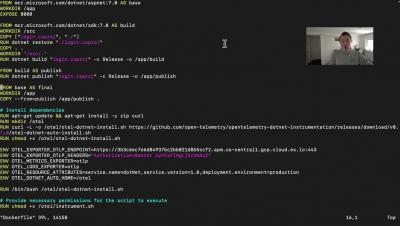
Elastic APM - Automatic .NET Instrumentation with OpenTelemetry
Don't Drown in Your Data - Why you don't need a Data Lake
As a leader in Security Analytics, we at Elastic are often asked for our recommendations for architectures for long-term data analysis. And more often than not, the concept of Limitless Data is a novel idea. Other security analytics vendors, struggling to support long-term data retention and analysis, are perpetuating a myth that organizations have no option but to deploy a slow and unwieldy data lake (or swamp) to store data for long periods of time. Let’s bust this myth.
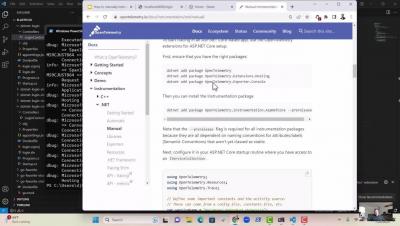
How to Manually Instrument .NET Applications with OpenTelemetry
Crafting Prompt Sandwiches for Generative AI
Large Language Models (LLMs) can give notoriously inconsistent responses when asked the same question multiple times. For example, if you ask for help writing an Elasticsearch query, sometimes the generated query may be wrapped by an API call, even though we didn’t ask for it. This sometimes subtle, other times dramatic variability adds complexity when integrating generative AI into analyst workflows that expect specifically-formatted responses, like queries.


