Operations | Monitoring | ITSM | DevOps | Cloud

LogicMonitor

Context is Key: Additive vs. Subtractive Topology

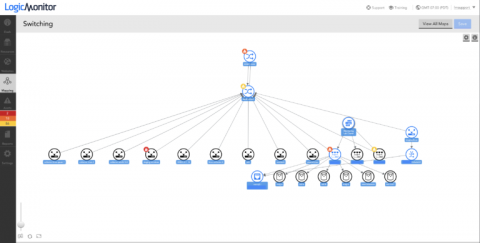
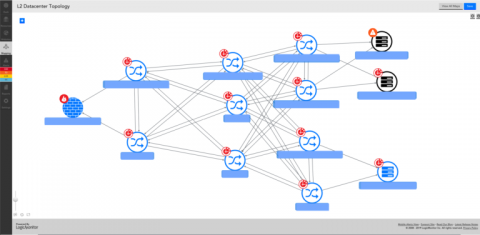
Understanding the context of an IT incident can greatly reduce the MTTR and enhance the ability to determine the root cause. In an IT environment, ‘context’ is used to refer to the subset of information necessary to troubleshoot and diagnose an incident, or event. For some scenarios, the context may be the downstream dependencies after a high availability pair of firewalls goes offline, and in others, it may be the datastore in contention from multiple VMs.

Simplify Troubleshooting with AIOps

There is a lot of industry buzz around how AIOps will affect change within IT Operations (ITOps). According to Gartner, Inc., the term “AIOps” describes platforms that combine big data and machine learning to support ITOps. This means that the problems being solved aren’t novel, the approach is. In ITOps or any other business unit, there are two primary constraints: time and money.

LogicMonitor Recognized in the 2018 Gartner Magic Quadrant for Network Performance Monitoring and Diagnostics for the First Time

We’re excited to share that Gartner, Inc. has positioned LogicMonitor in the 2018 Gartner Magic Quadrant for Network Performance Monitoring and Diagnostics* (NPMD) for the first time in the quadrant’s history.

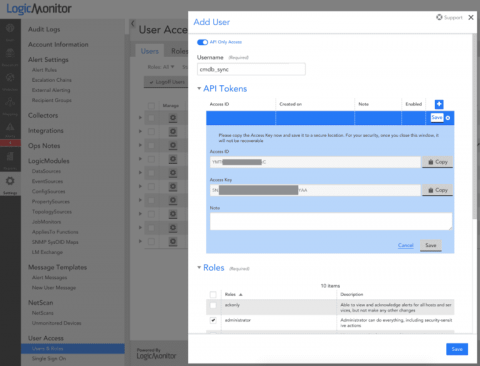
Getting Started with the LogicMonitor - ServiceNow CMDB Integration

A Configuration Management Database (CMDB) contains all relevant information about the hardware and software components used across an organization’s IT environment. Even more important, a CMDB defines the relationships and interdependencies between those assets. This makes it easy to understand, manage and report on the service being delivered.

Introducing the LogicMonitor - ServiceNow CMDB Integration. Let's get started.

The LogicMonitor - ServiceNow CMDB and ITSM integrations eliminate the typical time-consuming data sifting across systems so you can understand how the entire ecosystem is working, from infrastructure to applications, and are immediately notified when there are changes.

LogicMonitor's Kubernetes Monitoring Explained

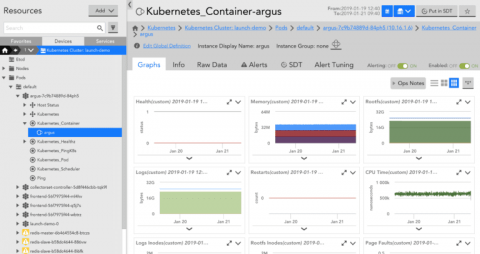
LogicMonitor’s Kubernetes Monitoring Integration enables you to comprehensively monitor your Kubernetes orchestrated container environment, and the applications running within, alongside the rest of your hybrid infrastructure in a single pane of glass. With automated monitoring and pre-configured alert thresholds for Kubernetes cluster components, container health, and application performance, you can be sure that you have the necessary visibility to maximize your container investment.

How to Monitor GKE with LogicMonitor

Google Kubernetes Engine (GKE) is a managed Kubernetes service that makes it possible to run Kubernetes clusters without managing the underlying infrastructure. With GKE, DevOps teams can scale and deploy applications faster with Kubernetes, while spending less time on cluster maintenance and configuration. Obtaining enough insight into GKE is key to proactively preventing downtime and maximizing application performance.