Operations | Monitoring | ITSM | DevOps | Cloud

Splunk

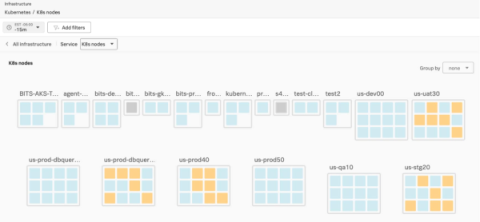
How To Set Up Monitoring for Your Hybrid Environment

The modern IT landscape consists of many distributed systems, which can pose a challenge if you are responsible for the end-to-end performance of these systems. As a platform engineer today, that is exactly what the job requires. You must juggle between dozens of tools to meet SLAs. This is why a modern solution is needed to bridge the gap between disjointed infrastructure and application stacks…and this is why the Splunk Observability platform was born.

How to Monitor Your Hybrid Applications Without Toil

About seventy-two percent of businesses operate in a hybrid IT environment, mixing their cloud-based services with traditional on-premises infrastructure. These hybrid environments offer many benefits, from scale, speed, and flexibility to security, cost savings, and control, blending the best of both worlds.

The Importance of Traces for Modern APM [Part 2]

In part 1, we looked at how the design plan of traditional monitoring technologies depended heavily on properties of the systems that were intended to monitor and then showed how those properties began to be undermined by an increase in complexity, an increase which can ultimately be captured by the concept of entropy. In this part, we will explore how increased entropy forces us to rethink what is required for monitoring.

Shadow IT & How To Manage It Today

In the business world, shadow IT is a controversial topic. Gartner defines Shadow IT as any IT devices, software and services that are used outside or beyond the ownership or control of IT departments/ organizations. This includes: In a standard work environment, the IT department would be responsible for providing whatever IT solutions and work tools were needed across all business functions.

RED Monitoring: Rate Errors, and Duration

The RED method is a streamlined approach for monitoring microservices and other request-driven applications, focusing on three critical metrics: Rate, Errors, and Duration. Originating from the principles established by Google's "Four Golden Signals," the RED monitoring framework offers a pragmatic and user-centric perspective on service performance.

AI Governance in 2024: An Overview

In a world where artificial intelligence (AI) seems is leaping forward and is growing at a CAGR of almost 40%, questions about governance and ethics with the use of AI are surfacing. As humans continue to develop AI systems, it is crucial to establish proper guidelines to ensure powerful technologies like generative AI and adaptive AI are used in a responsible manner.

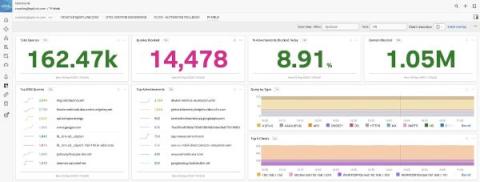
Monitoring Pi-hole using Pi-hole Exporter and OpenTelemetry: A Comprehensive Guide

Pi-hole is a fantastic open-source DNS-based ad blocker that enhances your online experience by blocking unwanted ads and trackers network-wide. Monitoring the performance and status of your Pi-hole setup is essential to ensure its effectiveness. Next, we'll explore how to use a Prometheus exporter to expose metrics from Pi-hole and have the OpenTelemetry collector scrape the metrics and send them to Splunk Observability Cloud.

How AI Can Catalyze Digital Resilience: An Introduction to Splunk's Philosophy

ChatGPT and other LLMs have become so accessible that even our grandmas know about AI. But what’s really happening beyond the hype? Recently, I sat down with IT and security leaders Cory Minton and Kirsty Paine to share the inside scoop on how we’re thinking about AI here at Splunk. Watch the replay of our conversation here.