Operations | Monitoring | ITSM | DevOps | Cloud

Splunk

Why You Need Observability With the Splunk Platform

Splunk’s extensible and scalable data platform has been instrumental in helping ITOps teams fully understand their tech environments and tackle any IT use case with data streaming, dashboarding, federated search, AI/ML, and more. But, with the explosion of telemetry and the growing complexity of digital systems, ITOps practitioners who rely solely on a logging solution are missing out on critical insights from their digital systems.

Open Source vs. Closed Source Software

In software development, two primary models of software exist: open source and closed source. Both types have their benefits and drawbacks, and understanding the differences between them can help you make informed decisions when choosing software for your projects. To simplify the concepts of open source and closed source software, let’s use the analogy of community cookbooks — open source — and a secret family recipe: the closed source.

Unlock the Power of Observability with OpenTelemetry Logs Data Model

Your log records may be missing a key ingredient that unlocks the world of observability for your applications, infrastructure and services. If you're building a new application or enhancing an existing one, consider adopting the OpenTelemetry Logs Data Model's Log and Event Record Definition. Adopting this definition enriches your logs by adding additional data, making it easier to use them to correlate them with metrics and traces, in addition to XYZ.

What are the benefits of an observability solution from Splunk?

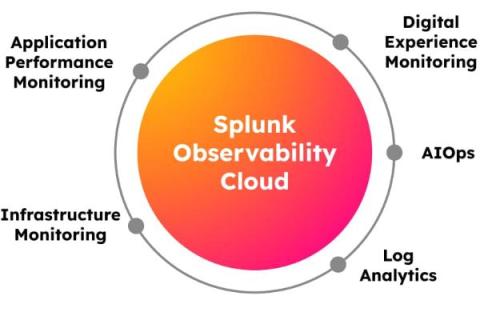
Organisations get a full-stack, end-to-end view of what is happening in a complex application environment. With Splunk Observability they can correlate logs, traces and metrics. They get a complete view of their application services, and can proactively see if something is going to happen and quickly detect the issue when a problem occurs.

Stream Amazon CloudWatch Logs to Splunk Using AWS Lambda

Amazon CloudWatch Logs enables you to centralize the logs from different AWS services, logs from your applications running in AWS and on-prem servers, using a single highly scalable service. You can then easily view these logs data, search them for specific error codes or patterns, filter them based on specific fields, or archive them securely for future analysis.

Why Splunk for observability?

How can Splunk bring ITOps- and engineering teams together so that they can deliver exceptional customer experiences? Splunk Observability can help enterprises and organisations solve problems within seconds. It's the only full-stack, analytics-powered and OpenTelemetry-native observability solution. Hear Robbie Baines, Observability Advisor at Splunk tell us more in this video.

Why is Splunk growing rapidly within the observability market?

As organisations are making the move from on-prem to cloud solutions built on microservices architecture, their monitoring has become more complex. To get a more holistic view of their application services a comprehensive observability solution is needed. Splunk Observability strengthens digital resilience by preventing unplanned downtime.

Continual Learning in AI: How It Works & Why AI Needs It

Like humans, machines need to continually learn from non-stationary information streams. While this is a natural skill for humans, it’s challenging for neural networks-based AI machines. One inherent problem in artificial neural networks is the phenomenon of catastrophic forgetting. Deep learning researchers are working extensively to solve this problem in their pursuit of AI agents that can continually learn like humans.