Operations | Monitoring | ITSM | DevOps | Cloud

Synthetics

Get the Coverage You Need in the User Experience Monitoring Space

Understanding user behaviour can help companies and organisations improve customer engagement, sales conversions, and customer service. On the other hand, not understanding user behaviour can result in lost customers and missed opportunities. So what is user behaviour, how does it affect your business, and how can you use it to improve your marketing efforts?

Cloud Computing - Complexity in Observability

Cloud computing has become a mainstream technology, and it's now easier to get started with the cloud than ever before. However, while the benefits of the cloud are undeniable, there are still challenges that you will have to face when using cloud services. One of these challenges is how difficult it can be to monitor an app or infrastructure. Cloud computing is a complex environment, so monitoring everything in it is challenging.

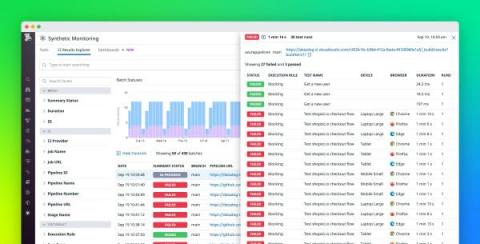
Run Datadog Synthetic tests in Azure Pipelines

Continuous integration (CI) demands continous testing: shifting left helps prevent faulty code from spreading, which is one of the core aims of CI. Datadog’s new Azure DevOps extension enables you to seamlessly incorporate integration and end-to-end tests into existing CI/CD workflows on Azure Pipelines, a dedicated CI/CD service that automatically runs builds, performs tests, and deploys your services and applications via cloud-hosted pipelines.

Why You Need Synthetic Monitoring

Synthetic monitoring can be one of the most powerful tools in your DevOps team’s toolkit, especially for the SRE, yet is one that is often overlooked by people building out a reliability mindset. Synthetic monitoring permits you to simulate any transaction or interaction users can have in your website or app, from places around the world, as often as you’d like.

Sponsored Post

The Importance of Observability for Site Reliability Engineers (SREs)

Site reliability engineers (SREs) play a crucial role in ensuring the reliability of systems. From creating software to improving system reliability in production, responding to incidents, and fixing issues, SREs are responsible for guaranteeing the health of applications.. And observability helps support SREs'. Because an observable system allows them to identify and fix issues promptly, resulting in SRE's being better equipped to fast-track development cycles.

Synthetic Monitoring of Microsoft AVD Service Levels

We recently announced a FREE ready-to-go standalone SaaS logon simulator tool for Microsoft AVD, available here. This joins our fully featured logon simulator available for use on-premises, as SaaS or in the cloud within our synthetic monitoring suite. A logon simulator, whilst a useful tool, should be used in conjunction with other synthetic and real user monitoring tools for a truly proactive IT strategy designed to prevent real users encountering issues and raising support tickets.

Synthetics 8.4.0 - Elastic Observability

Elastic 8.4.0 was released in August. In this video we cover what's new in 8.4.0 Observability, and go through demos of the newest features in monitor management, data retention, and the public beta. Join Synthetics Tech Lead Andrew Cholakian, and Synthetics Engineer Justin Kambic for the latest in Elastic Synthetics.

Synthetic Monitoring for Windows, VDI & 2FA | 2 Steps

We relate synthetic monitoring to a heart rate monitor for application performance. It fits hand in glove with real user monitoring and provides insights into how real customers and employees are experiencing the application. Historically, we’ve seen limitations with real user monitoring. If nobody is on the network or using the application, then you're not receiving any performance data. Also, the performance data that you typically receive is from a panel rather than every single user.

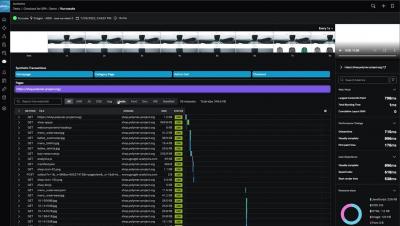
Splunk Synthetic Monitoring in Splunk Observability Cloud - Product Demo

Splunk Synthetic Monitoring is now available in Splunk Observability Cloud allowing IT and engineering teams to proactively detect issues impacting web and API performance and end-user experience and troubleshoot and remediate issues in the web browser, the server, or a third-party dependency—all within a single UI. Watch this quick demo to learn more.