Operations | Monitoring | ITSM | DevOps | Cloud

API

The latest News and Information on API Development, Management, Monitoring, and related technologies.

Why use a status page API and best alternatives

In the digital age, transparency and communication are key to customer satisfaction and operational efficiency, especially during downtime or degraded performance. This is where the importance of a status page comes into play, helping organizations effectively automate these communications, particularly through the use of status page APIs.

Building Modern REST APIs with OpenAPI

No, I'm not talking about 'OpenAI', though you certainly can use it to assist in your API designs. I'm talking about the OpenAPI standard, a modern spec for defining REST APIs. If you're reading this, I probably don't need to tell you that REST APIs are ubiquitous in tech. Practically every company has at least one, whether it be an internal or customer facing API. While other types of APIs have been gaining traction the last few years (GraphQL, gRPC, etc), REST is here to stay.

Lessons learned from running a large gRPC mesh at Datadog

Datadog’s infrastructure comprises hundreds of distributed services, which are constantly discovering other services to network with, exchanging data, streaming events, triggering actions, coordinating distributed transactions involving multiple services, and more. Implementing a networking solution for such a large, complex application comes with its own set of challenges, including scalability, load balancing, fault tolerance, compatibility, and latency.

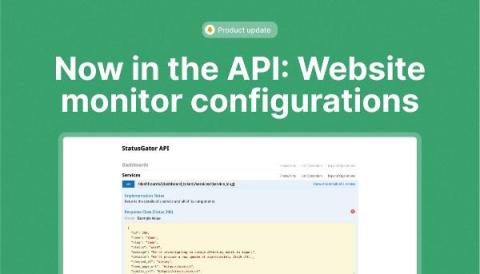
Now in the API: Website monitor configurations

As you may know, StatusGator has two monitor types at present: Cloud service monitors and website monitors. Our website monitor feature allows a myriad of sophisticated configuration options including interval config, HTTP methods, and content or status checks. We’ve just launched some important improvements to our API for those of you using website monitors. Our Service show endpoint will now include configuration details for those monitors that are website monitors under a new key called config.

Checkly adds deep synthetic monitoring to Coralogix with new integration

Starting today, Checkly users can send their traces from synthetics checks to Coralogix to view in-depth synthetic user data along with back-end APM based tracing. This gives SRE’s and Operations engineers a new insight into how the system is responding to automated synthetic tests of your service. For Checkly users, integrating with Coralogix data means it’s easy to correlate end-to-end user experience with backend performance, and track poor performance to its root cause.

How to test and monitor your APIs with Playwright

In today's video, we explore a lesser-known feature of Microsoft's Playwright - API Testing. We'll illustrate how to use Playwright for testing GraphQL as an example of an HTTP-based API; RESTful APIs can be tested too. We'll explain the usage of the 'request' fixture with Playwright, parse responses and validate their correctness. Moreover, we'll delve into executing multiple API requests in a single Playwright test case while testing their responses.

How to Fight Alert Fatigue with Synthetic Monitoring: 7 Best Practices

It’s 1am, and something has gone very wrong. The head of sales is in the incident response channel because our top customer is reporting a system-wide outage. Everyone’s running around trying to figure it out. As you look at service maps and traces, you get a sinking feeling. Earlier the previous evening, you got an alert that user-access-service was running out of memory.