Heineken brewers are sitting on “a pot of data gold” and use Splunk Cloud to connect all partners, drive business decisions and predict what product should be sold in what country.
See how Papa Johns onboarded more than 3,000 North American restaurant stores into Splunk Cloud for visibility into all technology that supports ordering in those stores. Additionally, Splunk’s Workload Pricing has helped Papa Johns optimize cost efficiency and drive maximum value through its data strategy.
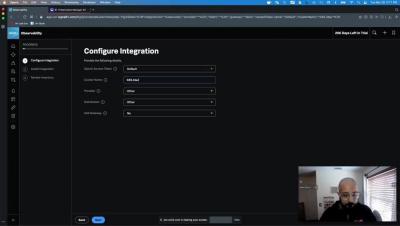
Watch Monitor and Alert on Your Kubernetes Clusters in Seconds to learn how Splunk Observability can help demystify challenges with monitoring distributed microservices. You’ll also view a demonstration on how to correlate application and infrastructure behavior to streamline troubleshooting and alerting on-premises and in the cloud.
With Splunk Log Observer Connect it’s easier than ever to correlate all of your metric, trace and log data to deliver better customer experiences! Available now for existing Splunk Enterprise and Splunk Observability Customers. Log Observer Connect lets observability users explore the data they’re already sending to their existing Splunk instances with Splunk Log Observer’s intuitive no-code interface integrated in Splunk Observability, for faster troubleshooting, root-cause analysis and better cross-team collaboration.
How do you thrive in today’s unpredictable world? You keep your digital systems secure and resilient. And above all, you innovate, innovate, innovate. Splunk is the extensible data platform that processes data from any cloud, any data center and any third party tool. At massive scale. We’re ready to help you accelerate your digital transformation and pave the way for incredible innovation.
With Splunk Log Observer Connect it’s easier than ever to correlate all of your metric, trace and log data to deliver better customer experiences! Available now for existing Splunk Enterprise and Splunk Observability Customers. Log Observer Connect lets observability users explore the data they’re already sending to their existing Splunk instances with Splunk Log Observer’s intuitive no-code interface integrated in Splunk Observability, for faster troubleshooting, root-cause analysis and better cross-team collaboration.
Splunk RUM is built for the latest web technologies and supports monitoring Single Page Applications (SPA) right out of the box. As an engineer, you can monitor performance of your route changes, network calls and javascript logic.
Identify the most impactful JS errors and their trends as you release new software versions. Splunk RUM groups errors by ID and stacktrace, and helps you visualize an errors impact on user groups, to scope and remediate errors more quickly.
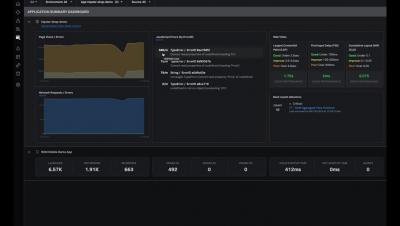
Splunk RUM (Real User Monitoring) helps software engineers quickly identify and isolate the most glaring client side performance issues, from errors to latency. Easily measure performance across your entire production environment, to specific services or applications, and seamlessly click into backend service performance.