Application Monitoring Overview: How to Track Errors with Sentry
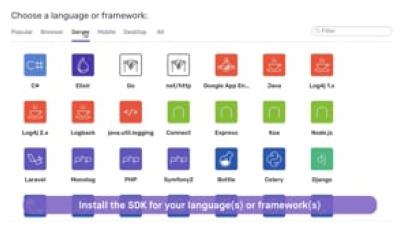
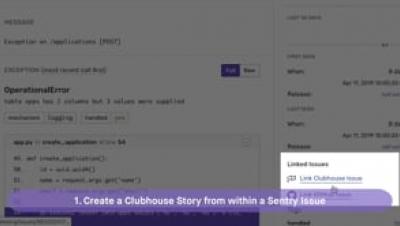
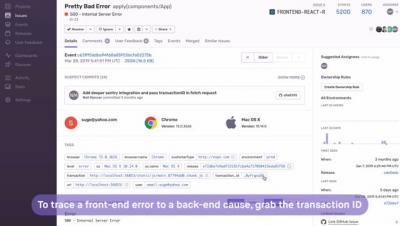
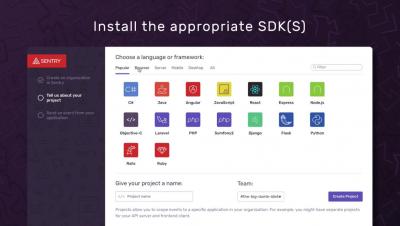
A quick walkthrough of the Sentry application monitoring platform. In just a few steps, Sentry allows developers to identify and fix production errors across every application in the stack. Get started by installing the appropriate SDK for your platform or platforms. All unhandled exceptions will be automatically captured by Sentry, with individual errors rolling up into larger issues. You will be able to quickly learn the impact of specific problems, examine the stack trace, and get added context about the application state, so you can connect issues to the root cause.