Operations | Monitoring | ITSM | DevOps | Cloud

Latest Posts

Application Monitoring with the Prometheus Client and GroundWork MonitorGot 7 minutes?

Prometheus is a popular open-source systems monitoring and alerting project. The project is a member of the Cloud Native Computing Foundation, joining in 2016 as the second hosted project, after Kubernetes. In this blog, we will demonstrate how to implement Application Performance Monitoring (APM) using the Prometheus GoLang client libraries API and de-facto standard data transport model to feed monitoring metrics into the GroundWork Monitor 8 server.

Visualizing NOC Operations with GroundWork NOC Boards

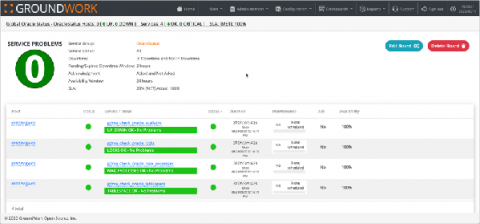
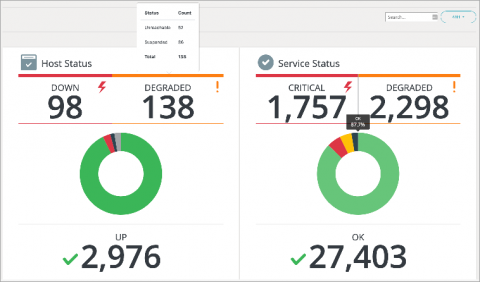
A monitoring system is a shared tool. It’s useful for teams to operate from the same source of information, since subjective opinions can lead insights astray, especially when troubleshooting systems and network issues. You need a single source of truth. A monitoring dashboard with drill-down capability is a basic tool for any NOC staff. Often displayed on kiosks or wall-mounted in the Network Operations Center (NOC), dashboards let you know at a glance whether anything needs attention.

Docker Container Monitoring with GroundWork Cloud Hub

Container technologies have captivated the computing world. Containers are the cornerstone for cloud computing and microservice architectures. Whether it be Docker™, Docker Compose™, or Kubernetes™, the IT world is embracing this technology with great enthusiasm. How can you monitor containers? They are different from traditional hosts and servers. For one thing, they are not physical machines; nor are they virtual machines.

The Value of Correlation

Data that is static or that behaves the same way day-to-day isn’t indicating aberrant behavior. Looking at the correlation of data from today with data from yesterday can tell you if today is different in some way: positive correlation means today is related to yesterday, particularly if deviation is high. Negative correlation with high variability means that today isn’t like yesterday at all.

The Benefits of Running GroundWork Monitor in Containers

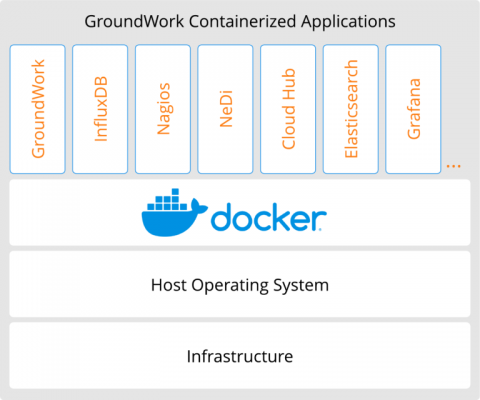
If you have been watching our announcements, you know we have recently released a major new version of GroundWork Monitor Enterprise, version 8. As I write this, that’s actually 8.0.1, which is a little more than the first release. The thing about version 8 though, is that it’s containerized. That’s right, all of the many processes that GroundWork uses to monitor, alert, log, and report on your infrastructure are all running in Docker containers.

Cloud Service Monitoring with GroundWork Cloud Hub

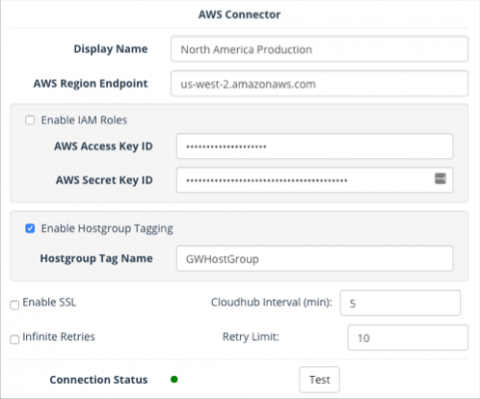
Cloud Computing Services like AWS, Google Cloud and Microsoft Azure are revolutionizing IT infrastructures at a rapid rate. However, businesses have not completely adopted Cloud services, and many of us are still running hybrid on-premise and cloud solutions. The GroundWork solution is to unify all monitoring, whether it be on-premise or in the cloud.

How Unified Monitoring Can Help Make Your IT Life Easier!

Unified Monitoring provides real-time understanding of what is happening, every time and everywhere on the network, and everything connected to it. With Unified Monitoring, engineers are more able to support proactive identification of root causes and deploy the actions and resources needed to maintain the health and integrity of all connected IT assets.

Announcing GroundWork Monitor 8

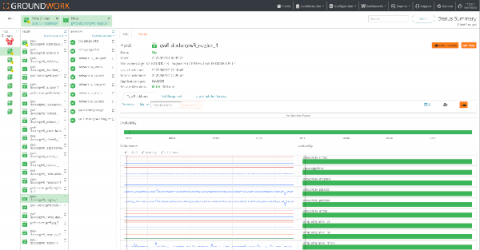
GroundWork Monitor 8 is a new version of a mature product, GroundWork Monitor Enterprise. As such, a lot of what is inside of this version will be familiar to users of prior versions. For example, we are still using the same bundled GPL Nagios™ and GroundWork Distributed Monitoring Agent (GDMA), and we are still including NeDi and Cloud Hub as data feeds. Then again, much is very new. We have completely re-worked the status screens and made them much more responsive.