Operations | Monitoring | ITSM | DevOps | Cloud

Latest Posts

Grafana Cloud updates: cool visualizations, log monitoring made easier, simplified alert routing

We are consistently releasing helpful updates and fun features in Grafana Cloud, our fully managed observability platform powered by the open source Grafana LGTM Stack (Loki for logs, Grafana for visualization, Tempo for traces, and Mimir for metrics). In case you missed it, here’s a roundup of the latest and greatest upgrades for Grafana Cloud this month. If you’re not a Grafana Cloud user, what are we waiting for?

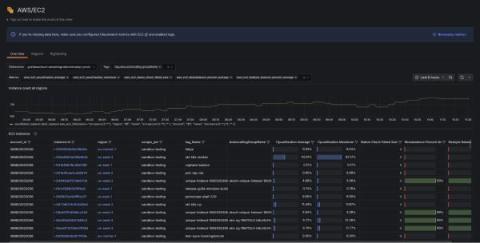
AWS Observability in Grafana Cloud: A simpler, more intuitive cloud monitoring app

We know monitoring your AWS environment can be difficult, which is why we’re thrilled to tell you about a new application we’ve built to make the entire process easier, more efficient, and more intuitive. We’ve offered AWS monitoring capabilities for some time, but with the AWS Observability application in Grafana Cloud, we’ve distilled our collective efforts into a more integrated and potent solution.

The engineering on-call experience: misconceptions, lessons learned, and how to prepare

The on-call experience is sometimes a dreaded one for software engineers. Those late-night alerts and frantic Slack messages, after all, don’t exactly sound pleasant. But what’s an on-call shift really like? Is that perception of constant fire-fighting and 3 AM wake-up calls actually realistic? Michael Mandrus and Owen Smallwood, both senior software engineers here at Grafana Labs, wanted to set the record straight.

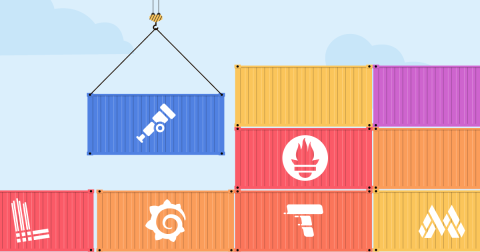
An OpenTelemetry backend in a Docker image: Introducing grafana/otel-lgtm

OpenTelemetry is a popular open source project to instrument, generate, collect, and export telemetry data, including metrics, logs, and traces. OTel, however, does not provide a monitoring backend — and this is exactly where the Grafana stack comes in. Here at Grafana Labs, we’re fully committed to the OpenTelemetry project and community.

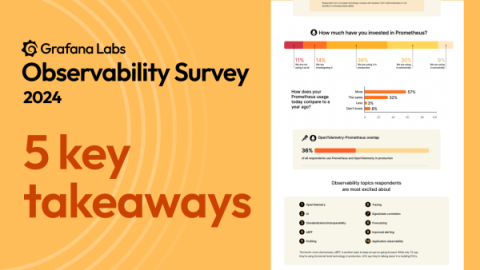
5 key takeaways from the Grafana Labs' 2024 Observability Survey

Regardless of the industry they operate in or the number of people they employ, businesses with mature observability practices can respond to incidents faster — and save time and money in the process, according to the second annual Grafana Labs Observability Survey. Organizations are making observability a critical part of their software development lifecycles as they grapple with the complexity of modern applications.

How to use PGO and Grafana Pyroscope to optimize Go applications

Profile-guided optimization (PGO) is a compiler feature that uses runtime profiling data to optimize code. Now fully integrated in Go 1.21+, PGO is a powerful tool to boost application performance — and with Grafana Pyroscope, our open source continuous profiling database, you can significantly magnify the value of PGO. In this post, we’ll explore what PGO is, how the Pyroscope team has used it internally to improve performance, and how you can use PGO to make your own programs faster.

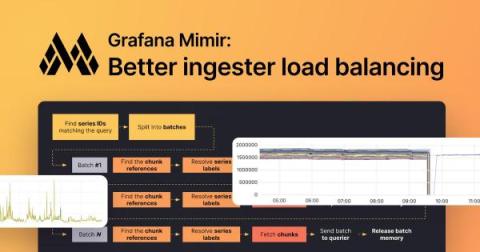
How we improved ingester load balancing in Grafana Mimir with spread-minimizing tokens

Grafana Mimir is our open source, horizontally scalable, multi-tenant time series database, which allows us to ingest beyond 1 billion active series. Mimir ingesters use consistent hashing, a distributed hashing technique for data replication. This technique guarantees a minimal number of relocation of time series between available ingesters when some ingesters are added or removed from the system.

Grafana 10.4 release: Grafana Alerting improvements, visualization updates, new plugin, and more

Grafana 10.4 is here! The latest version of Grafana introduces feature updates, a new plugin, as well as provides a preview of functionality we intend to make generally available in Grafana 11, which will be featured at GrafanaCON 2024 in April. Download Grafana 10.4 Until then, the Grafana 10.4 release includes upgrades to the canvas, geomap, and table visualizations. There is also a quicker way to set up alert notifications in Grafana Alerting and a new UI for configuring SSO.

How to visualize SurrealDB data with Grafana

Whether your data is on the moon or in your basement, Grafana has got you covered. As the go-to platform for monitoring and observability, Grafana has been your trusty sidekick for data visualization for years, in part because we’re always looking for new ways to support our users, no matter where they keep their data. That’s why we’re excited to tell you about our latest supported data source — SurrealDB.