Operations | Monitoring | ITSM | DevOps | Cloud

Latest Posts

The New Event Viewer

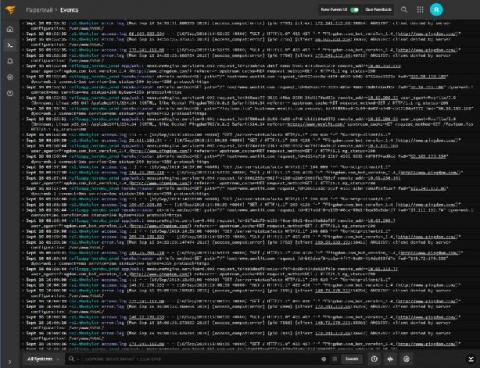
The event viewer is the heart of SolarWinds® Papertrail™, where you tail logs, save searches, and create alerts. For most Papertrail users, this is where they spend the majority of their time in Papertrail. We’ve wanted to update and modernize the event viewer for a while. But knowing that any change to the event viewer can have a large impact on how users find and troubleshoot issues, we wanted to make sure we got it right.

Logging with Context

When troubleshooting an issue with logs, it’s often fairly easy to find an important log; for example, an exception is logged and an alert is fired. Once you find an exception in the logs, the trickier part can be understanding why the exception was thrown. One common approach to this problem is looking at the surrounding logs. Logs are typically in chronological order, so if you see an exception, look at the logs’ lines from just before the exception occurred.

Take Troubleshooting Up a Notch and Add Context to Your Logs

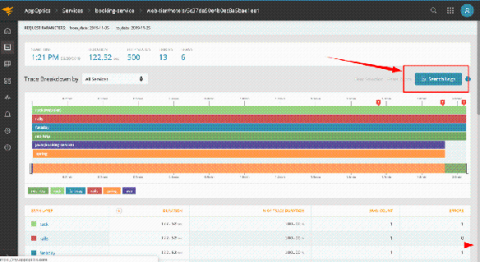
Today we announced an integration between SolarWinds® AppOptics™ and SolarWinds Papertrail™ to allow you to quickly move from service-level metrics, down to a trace, and then down to the logs specific to that trace. The integration between AppOptics and Papertrail provides the ability to group the log messages from a traced transaction and add trace context to your logs in Papertrail.

Monitoring Machine Learning Models Built in Amazon SageMaker

Many data science discussions focus on model development. But as any data scientist will tell you, this is only a small—and often relatively quick—part of the data science pipeline. An important, but often overlooked, component of model stewardship is monitoring models once they’ve been released to the wild. Here we’ll aim to convince any unbelievers that monitoring deployed models is as important as any other task in the data science workflow.

Benchmarking Popular Node.js Logging Libraries

Sometimes developers are hesitant to include logging due to performance concerns, but is this justified? And how much does library choice affect performance? The team at SolarWinds® Loggly® and myself decided to find out. We ran a series of performance tests on some of the most popular Node.js libraries. These tests are designed to show how quickly each library processed logging and the impact on the overall application. Let’s see how they did!

Better Logging for Lambda Functions

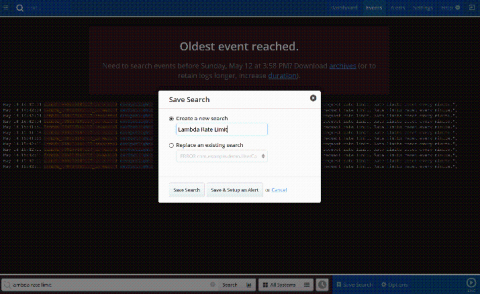
Serverless architectures such as AWS Lambda have created new challenges in debugging code. Without a solid logging framework in place, you could waste hours, or even days, tracking down simple defects in your functions. A strategic logging framework can be a powerful way to track down and resolve bugs. Let’s walk through how to get the most out of logging Lambda functions.