Operations | Monitoring | ITSM | DevOps | Cloud
Latest Posts
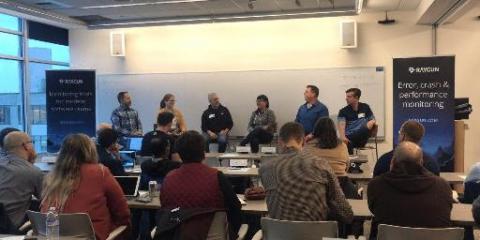
Why actionable data is worth its weight in gold and more from our Tech Leaders' Tour
Monitoring today is more complex and nebulous than ever before. Teams have to deal with barriers like tooling, data overwhelm, and process problems making it difficult to get a clear line of communication from code to customer. In our Portland Tech Leaders’ event, our seasoned host Scott Hanselman, Partner Program Manager at Microsoft, takes us on a deep dive into how our experienced panel use tools, processes, and agile workflows to overcome these hurdles to create world-class software.
Measuring the unmeasurable - How AWS, Alexa, Tableau Software and Raygun monitor what matters
“3.7%. That’s how penetrated the cloud market is today. We’re talking a trillion-dollar market only penetrated by 3.7%. The world is up for grabs.” “Customers are not going to want technology to be slower. They’re not going to want it less performant or less secure.
Raygun APM: Our commitment to performance
Ever since the public release of Raygun APM for .NET, we’ve been busy at work to make this the best APM product on the market that provides meaningful data to developers, making debugging and troubleshooting much easier. Every APM product out there will incur some level of performance penalty since you cannot observe a process at zero cost.
Speed AND Reliability: How to move fast and fix things [Webinar]
A complete guide to getting started with the Node debugger
Diagnosing and finding the root cause of issues is a crucial skill in software development. Software engineers spend the majority of their time reading and understanding existing code. Because of this, knowing how to debug your applications with proficiency will save you time and make you more effective.
Stop using NPS to measure software quality
Using NPS as an engineering metric gets product owners into hot water. A good NPS score is seen in software communities as the benchmark for a product-first company and regularly features on executive and IPO reports. It's so common that over two-thirds of the Fortune 1000 claim to use it. But imagine if every software tool you used sent you regular NPS surveys? Response rates will suffer and the metric will slowly become less and less valuable over time.
Build faster, error-free Universal Windows Platform (UWP) apps with Raygun
With 900 billion devices running on Windows 10, the future is bright for the Universal Windows Platform (UWP). UWP’s strength lies in its ability to adapt itself completely to the native user interface - whether that’s a computer, tablet, Xbox or IoT device. It’s a win-win; users get a consistent experience as they consume across devices, while developers get easier deployments.
Monitoring .NET Core - Raygun's multithreaded trace capability explained
Raygun’s CTO Jeremy Norman chats with Alex Williams of The New Stack to give a technical demo of the multithreaded trace feature in Raygun APM. Jeremy offers practical examples of how traces work, how you can monitor microservices more accurately, and why Raygun is different from other APM tools.
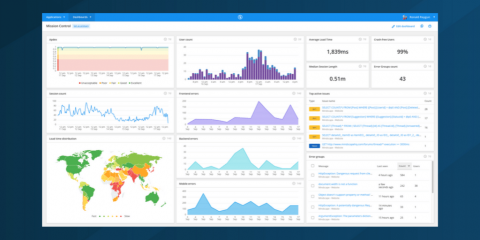
Introducing unlimited dashboards - Now available on all plans
Raygun gathers a great deal of data about how users are interacting with your applications - from errors and crashes to users affected by performance problems. We help thousands of teams gain visibility into the health of their apps - and one of the best ways developers do that is with Raygun’s dashboards. When we first launched dashboards in 2017, we knew you needed them to be easy to use, customizable, and actionable.


