Dashboards

How to Build an Effective Network Monitoring Dashboard

Whether you're a small startup or a large enterprise, the health and performance of your network infrastructure are critical to your success. This is where network monitoring comes into play. Network monitoring involves the continuous observation and analysis of network traffic, devices, and performance metrics to ensure smooth operations, detect anomalies, and troubleshoot issues promptly.

OpenSearch Dashboards vs Kibana

In this guide, we will compare two of the leading data visualization tools based upon open-source software that are available for use for metrics, traces and log analysis. To allow new users to know exactly which solution may be best suited to their needs, we wanted to explore in more depth a comparison between OpenSearch Dashboards and Kibana across various aspects in our latest guide covering the differences between leading open-source software.

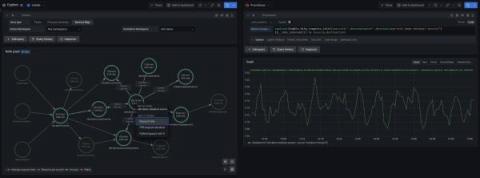
How to monitor Kubernetes network and security events with Hubble and Grafana

Anna Kapuścińska is a Software Engineer at Isovalent, who has a rich experience wearing both developer and SRE hats across the industry. Now she works on Isovalent observability products such as Hubble, Tetragon, and Timescape, as well as the respective Grafana integrations for all of them.

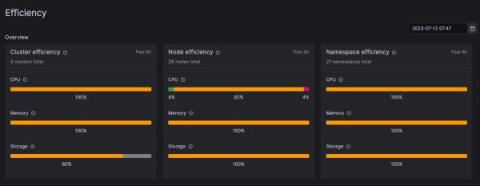
Monitor the past, present, and future of your Kubernetes resource utilization

Greetings, Kubernetes Time Lords! Through a series of recent updates to our multi-purpose Kubernetes Monitoring solution in Grafana Cloud, we’ve made it easier than ever to assess your resource utilization, whether you’re looking at yesterday, today, or tomorrow. All companies that use Kubernetes, regardless of size, should monitor their available resource utilization. If a fleet is under-provisioned, the performance and availability of applications and services are at serious risk.

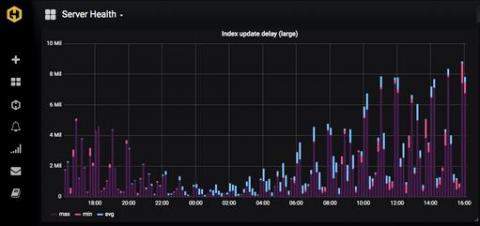
How to display a metric on a Graphite dashboard

Graphite is free and open-source software. It is used as a time-series database monitoring tool, where you can collect, store and display time-series data in real-time. As you can monitor certain metrics of this data using Graphite, it has a very useful and simple dashboard used to visualize these metrics. This article will show you how to display a metric on your Graphite dashboard. MetricFire specializes in monitoring systems.

Trusted Types: How we mitigate XSS threats in Grafana 10

Grafana is a rich platform for data visualization, giving you full control over how your data should be visualized. However, this flexibility and freedom comes with some challenges from a security perspective — challenges that need to be solved to protect the data in Grafana. For years, cross-site scripting (XSS) has been among the most common web application security vulnerabilities.

Distributed tracing for testing with Grafana Tempo and Tracetest (Grafana Office Hours #05)

Did you know you can use distributed tracing for testing with Grafana Tempo and Tracetest? Distributed tracing can really help you drill down from metrics to root causes, but how can you automate it? Adnan Rahić, Senior Developer Advocate at Tracetest.io, shares how you can do just that, using Grafana + Grafana Tempo + Tracetest.

How we improved Grafana's alert state history to provide better insights into your alerting data

The Prometheus alerting model is a flexible tool in every observability toolkit. When enhanced with Grafana data sources, you can easily alert on any data, anywhere it might live, using the battle-tested label semantics and alerting state machine that Prometheus defines. Often, engineers want to see patterns in their alerts over time, in order to observe trends, make predictions, and even debug alerts that might be firing too often.