Dashboards

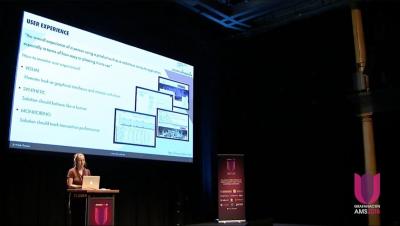
GrafanaCon EU 2018: Inherited Technical Debt - A Tale of Overcoming Enterprise Inertia

Amgen has been on a journey to confront the multi-million dollar elephant in the room. Technical debt that had been passed down for 10 years in their monitoring portfolio. But how to overcome inertia and a failure to understand how to maximize internal value for data that belongs to organization to begin with?

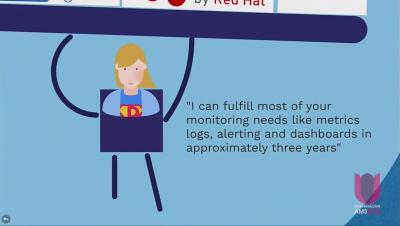
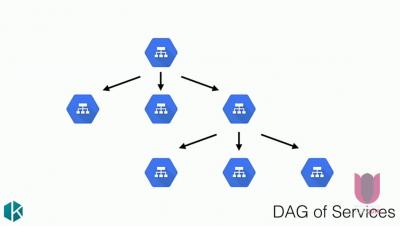
GrafanaCon EU 2018: What Does Kubernetes Look Like? Performance Monitoring and Visualization with Grafana

Monitoring Kubernetes is vital to understanding the health and performance of a cluster, but which metrics are most important to add to your dashboards and alert on? Jacob will discuss how to most effectively monitor and visualize your Kubernetes cluster using the Grafana Kubernetes plugin and PromQL.

Visualize & Create Dashboards With Grafana In GroundWork Monitor

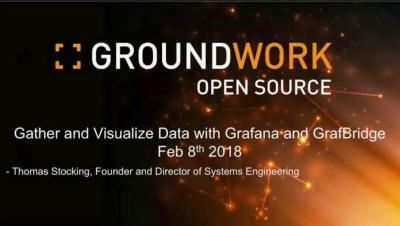
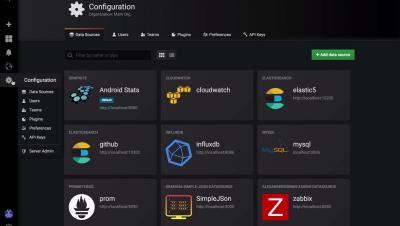
This webinar presented by GroundWork Open Source shows users how to gather and visualize data in a clear, flexible way using Grafana dashboards in GroundWork Monitor. We'll show you how to gather data from any source, including time series data. We'll also walk through how to set your own thresholds and alerts. Presented by GroundWork Open Source founder and vice-president of product strategy, Thomas Stocking.