


|
By Adnan Rahic
Gateways are now a named resource in Bindplane with their own page, a guided setup, and a one-step migration for anything already running the Bindplane Gateway source. Around that we added destinations for CrowdStrike Falcon Next-Gen SIEM, Arize AX, and Arize Phoenix, gave the Overview page a third tab. Prefer to watch? The October Community Call is streamed live on YouTube. Watch " YouTube" on YouTube Watch.
|
By Adnan Rahic
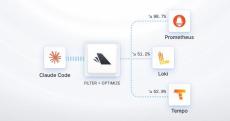
Why is the telemetry AI agents generate so intimidating? If you turn on Claude Code’s internal telemetry it’ll throw a wall of text at you. And, it’s very expensive to store. But, the bigger issue is that you can’t make sense of it. Luckily it’s all OpenTelemetry native. That means you can configure it to send, transform, and store what you really need. Which raises the only question that matters. What do you actually need?
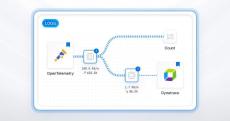
Ask a platform team why their observability bill keeps growing and you'll often get a one-sentence answer: And that's usually where it ends. The application teams own the log output, the platform team owns the bill, and nobody has the leverage to change what gets emitted. A single retry loop can print the same error thousands of times a minute. Every one of those lines is ingested, indexed, and stored. You pay for all of them, and they tell you exactly one thing: this error happened, a lot.

|
By Adnan Rahic
Also this month, a new BDOT 1.107.0 release, and you can start a configuration from a Full-Pipeline Blueprint. Here’s what happened in the last month. Prefer to watch? The September Community Call is streamed live on YouTube. Watch " YouTube" on YouTube Watch.
|
By Justin Voss
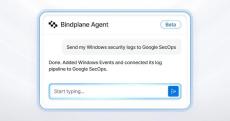
Pipeline Intelligence already recommends processors, reads live telemetry, detects log types, and generates processor bundles from natural language. But most of it lives inside a single processor node. You still have to know which one to open and what to ask for. This changes today. Bindplane Agent is your AI assistant inside Bindplane, ready to act on what you describe in plain language.
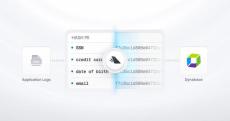
Ask a platform team why their application logs aren't in their observability backend and you'll often get a one-sentence answer: And, that's where the conversation ends. The logs stay in a silo. Or, they don't get collected at all. The team loses the troubleshooting signal, and nobody revisits the decision because the alternative looks like a compliance violation. Application logs in healthcare, aviation, insurance, and retail are full of personal information that should not be stored in plain text.

|
By Adnan Rahic
Full-Pipeline Blueprints are the headline, and Scoped API Keys went to preview. Here is the rundown.

|
By Adnan Rahic
Blueprints launched as processor bundles, and that solved the repetitive middle of the problem. But the middle was never the whole job. You still had to know which source type to add, which parameters mattered, how to batch for your backend, and how to route it all together. That changes now. The first two cover the two requests we hear most.
|
By Amrith Raj
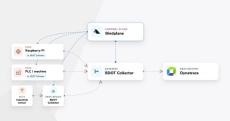
By the time an IoT device shows up in an incident review, it has usually already done its damage. Not the dashboard-gap kind. These devices are load bearing. They sit in the control path of substations, haul trucks, pump stations and cold rooms, so when they go blind the blast radius gets measured in tripped relays, spoiled stock, and unplanned outages rather than in missing datapoints.

|
By Paul Stefanski
Originally written by Paul Stefanski, updated by Dylan Myers. Data costs fill a large column in many organizations' accounting sheets. Data pipeline setup and management is a significant time sink for DevOps, IT, and SRE. Setting up telemetry pipelines to reduce unwanted data often takes even more time, which could better be spent creating value rather than reducing costs. This post will show you how to quickly set up your data pipeline to filter unnecessary telemetry data.
|
By Bindplane
Observability engineers will spend weeks tuning instrumentation. Security engineers? They want a collector installed and logs flowing — yesterday. And that's actually the magic of OpenTelemetry + Bindplane: from day one you're routing firewall logs, endpoint data, server logs straight into your SIEM with zero instrumentation lift. One toolchain. Two teams. No silos. Filmed at Google Cloud Next '26 — Las Vegas bindplane.com#OpenTelemetry.
|
By Bindplane
Critical vulnerabilities are critical because they're easy to exploit — but most breaches don't even need them. Tony explains why phishing remains the dominant attack vector, why strong instrumentation matters for forensics (tracing an API call through a database to see exactly what was leaked), and how observability data becomes security data when something goes wrong. The system is harder to breach than the human. And that's the whole game.

|
By Bindplane
Bindplane at Google Cloud Next 2026. A quick recap of our booth, demos, conversations, and how Bindplane helps teams build smarter OpenTelemetry pipelines for Google SecOps and modern telemetry operations.
|
By Bindplane
OpenTelemetry Project Updates | Observability Day Europe Catch up on the latest OpenTelemetry project updates from Observability Day Europe. This session covers recent stability milestones, new tooling, and what's in progress across the OTel ecosystem.

|
By Bindplane
Tune in for the Bindplane Community Call in March to learn more about SSO going GA, a wave of new updates, connectors, sources, and destinations, including a VictoriaMetrics partner integration — and a preview of what we're building next. We'll also share details on meeting the Bindplane team at KubeCon + CloudNativeCon Europe in Amsterdam. As always, hands-on demos and a live Q&A at the end.

|
By Bindplane
Chelsea from the Customer Success team walks through the Bindplane Blueprints for ClickHouse guide — showing how to optimize logs, metrics, and traces before they land in ClickStack. You’ll see how to: ClickHouse is powerful. But raw telemetry at scale gets expensive fast. Bindplane acts as the control plane for your OpenTelemetry infrastructure. Blueprints let you apply production-ready processing logic instantly without YAML sprawl or config drift.
|
By Bindplane
We loaded 10,000 messages into a persistent queue. Then watched it vanish. This is what the Pebble persistent queue storage extension looks like inside a Bindplane-managed OpenTelemetry pipeline. Resilience under pressure.
|
By Bindplane
Bindplane now supports the Pebble storage extension for the OpenTelemetry Collector persistent queue. Faster recovery. Durable buffering. More control over telemetry under load. Own your pipeline.

|
By Bindplane
OTel Unplugged 2026 was different by design. Held alongside FOSDEM in Brussels, this was an unconference built by the OpenTelemetry community, for the community. No sales pitches. No product demos. Just honest conversations about what’s working, what’s broken, and where OTel needs to go next. In this recap, you’ll hear short interviews and reflections from engineers, maintainers, and practitioners on.
|
By Bindplane
Google Cloud Security Operations is deprecating the legacy SecOps Forwarder, and OpenTelemetry with Bindplane is the official telemetry ingestion method. In this workshop, you’ll learn how to migrate from the SecOps Forwarder to Bindplane and OpenTelemetry Collectors, the officially supported ingestion model for Google SecOps going forward. We walk through the why, the what, and the how — with practical guidance you can apply immediately.

|
By ObservIQ
Businesses require a single cohesive view across all systems as they increasingly shift to running today's modern interconnected application stacks.
- October 2026 (2)
- September 2026 (4)
- August 2026 (4)
- July 2026 (3)
- June 2026 (4)
- May 2026 (8)
- April 2026 (5)
- March 2026 (3)
- February 2026 (8)
- January 2026 (3)
- December 2025 (8)
- November 2025 (1)
- October 2025 (1)
- September 2025 (3)
- August 2025 (5)
- July 2025 (1)
- June 2025 (14)
- May 2025 (5)
- April 2025 (7)
- March 2025 (3)
- February 2025 (6)
- January 2025 (4)
- December 2024 (1)
- October 2024 (6)
- September 2024 (10)
- August 2024 (6)
- July 2024 (6)
- May 2024 (11)
- April 2024 (2)
- March 2024 (7)
- February 2024 (2)
- October 2023 (6)
- September 2023 (6)
- August 2023 (8)
- July 2023 (10)
- June 2023 (5)
- May 2023 (8)
- April 2023 (6)
- March 2023 (4)
- January 2023 (1)
- December 2022 (2)
- November 2022 (5)
- October 2022 (3)
- September 2022 (2)
- August 2022 (7)
- July 2022 (9)
- June 2022 (4)
- May 2022 (5)
- April 2022 (1)
- March 2022 (1)
- January 2022 (1)
- December 2021 (1)
- November 2021 (3)
- October 2021 (6)
- September 2021 (10)
- August 2021 (11)
- July 2021 (5)
- June 2021 (3)
- May 2021 (2)
- April 2021 (2)
- March 2021 (3)
- January 2021 (3)
- September 2020 (1)
- July 2020 (3)
Built by engineers for engineers, observIQ's solutions accelerate, simplify, and enhance observability across today's hybrid environments.
Our mission is to build the best open source observability solutions for DevOps and ITOps. Our open source log agent is a highly configurable, high-performance agent made for ELK logging within the ELK stack, featuring a full library of pre-built log plugins to support your existing applications.
Benefits of observIQ Cloud:
- Deploy In Minutes: Quickly configure end-to-end log management using one-line agent installation commands, guided remote configuration, and over 40 pre-built integrations.
- Aggregate Logs At Scale: Our high performance, open source log agent, Stanza, is designed with performance and resilience in mind, allowing you to confidently deploy at any scale.
- Utilize Powerful Visualization and Analysis: Search, filter, and visualize your events with ease using our customized version of Kibana. Dashboards are auto-installed for each integration so you can get to root cause quickly.
- Reduce MTTR With Simplified Diagnosis: Logs are automatically parsed and enriched with critical environment information, providing the context needed to easily trace events to the failing application, container, or service.
- Enable Immediate Response: Using customizable threshold-based alerts, you can notify on critical events from your application or infrastructure. Leverage your existing alerting workflows using e-mail or 3rd party applications like Slack and Pagerduty.
- Apply Simple Lifecycle Management: Manage your fleet of agents and integrations, all from a user-friendly interface. Save time by updating all of your agents with a single click.
The intuitive log management platform that ITOps and DevOps actually want to use.