Operations | Monitoring | ITSM | DevOps | Cloud

Icinga

Binero.Cloud transitions from Nagios to Icinga to enhance user experience

We´re proud of our many customers and users around the globe that trust Icinga for critical IT infrastructure monitoring. That´s why we´re now showcasing some of these enterprises with their Success stories. It´s stories from companies or organizations just like yours, of any size and different kinds of industries. Some of them are our long-standing customers, others have just recently profited from migrating from another solution to Icinga.

Scheduling Tasks in PHP

In the scenario where you want to execute tasks repeatedly at a specific time and have full control over when they are executed and how the results are handled, it makes sense to build this into your application instead of setting up a cron job, for example. I’d like to give you a quick example of how you can achieve this in PHP using two great libraries, ReactPHP and cron-expression. ReactPHP is an event-driven programming library that has an event loop at its core.

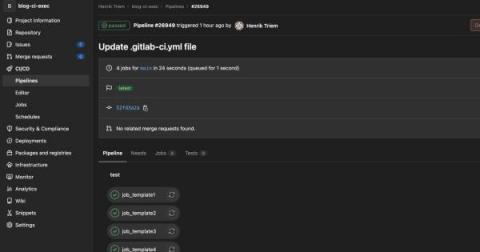
GitLab CI/CD Job Templates!

Like I’ve mentioned in my last blog post, we use GitLab pipelines for packaging. We have a lot of software, like Icinga, Icingaweb and its various modules, which we want to build across multiple different operating systems. This results in a huge number of jobs and pipelines, doing very similar stuff. We have a lot of code repetition, and this is bad – code repetition means higher code maintenance , and it invites bugs.

Icinga + Guacamole

One of Icinga’s greatest strengths is its ability to integrate with other systems and use those systems’ data to enrich monitoring. It can write time-series data to InfluxDB, Graphite or even Prometheus with our icinga2-exporter. It can talk to different data sources so that hosts and services can be created and managed automatically. This means that lots of manual work is eliminated.

Quick tip: How to create Icinga reports with custom branding

With Icinga Reporting you can create custom SLA reports for hosts and services that are monitored with Icinga. The module for Icinga Web fetches existing data and takes planned downtimes into account. You can filter for certain hosts and services as well as set custom thresholds to highlight unmet SLAs visually. You decide if you want to create the reports either manually or automatically, for example every week or month. The report then is sent to you as a PDF via email.