Operations | Monitoring | ITSM | DevOps | Cloud

Komodor

Troubleshooting in Kubernetes: The Shift-Left Approach

Kubernetes has become the de-facto container management solution of the last decade—and we have no doubt it will stay that way in the upcoming years. It provides a solid abstraction between the infrastructure layer and applications, so that developers can quickly develop, deploy, and operate their applications. Kubernetes is designed as a set of APIs that work together. If you deploy simple applications and make them run, Kubernetes will do it for you.

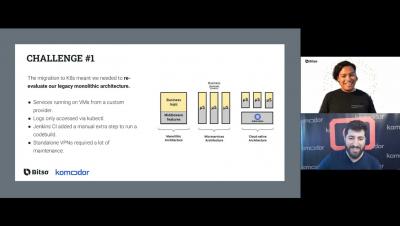
How Bitso Empowers Its Devs to Troubleshoot K8s Independently

More often than not, Kubernetes is behaving as it should: fast, agile and scalable. But what happens when K8s misbehaves? Do the responders have the right tools to deal with the situation? Or are they just part of an escalation chain that always leads to the same small group of experts? Meet Bitso, a billion-dollar company and the largest crypto platform in Latin America, which has mastered the shift-left approach and empowered its dev team to troubleshoot K8s independently.

ValidKube Update: Adding Polaris to Auto-Audit K8s YAMLs

A month and a half ago we released ValidKube, our first OS project that fused the capabilities of three other popular OS tools (kubeval, kubectl-neat and trivy) in a single easy-to-use microsite. Using the microsite, any user could ensure the security and hygiene of their K8s YAML, with just a few clicks of the button, pretty much on the fly. ValidKube was born out of a straightforward concept and we were happy to see its user-friendly approach resonate almost immediately.

6 Metrics to Watch for on Your Kubernetes Cluster

Kubernetes. Nowadays it seems companies in the industry are divided into two pools: those that already use it heavily for their production workloads and those that are migrating their workloads into it. The issue with Kubernetes is that it is not a single system the way Redis RabbitMQ or PostgreSQL are. It is a combination of several control plane components (for example etcd, api server) that run our workloads on the user (data) plane over a fleet of VMs.

Crossing K8s Monitoring and Observability Gaps With Change Intelligence

Recently we had the privilege of being named a Gartner Cool Vendor in the Monitoring and Observability category. The funny thing is, while this is definitely the closest Gartner category for our solution, we aren’t really used to thinking about Komodor as a monitoring and observability tool.

[Webinar] 5 Things We Learned Not to Ignore While Scaling Kubernetes

Using Kubernetes for orchestration? Great—we hope things are running smoothly. The thing about Kubernetes, though, is that it tends to surprise you—throwing curveballs just when you think you've finally mastered the art of container management. And those curveballs usually come at you when you try to scale up. So, how can you scale K8s without striking out due to speed and reliability (not to mention sanity) issues?

Just Launched ValidKube. Here Are 7 Other K8s Open Source Projects We Love!

I am excited to share that we’ve just launched our first open source project called ValidKube. The idea behind Validkube is to fuse together the capabilities of three other popular open-source projects (kubeval, kubectl-neat and trivy by Aqua) and present them in a single view, providing users with a way to ensure YAML code hygiene and security, all at the same time and with just a few clicks of the button.

How One Company Accidently Autoscaled to 200 Nodes and Crashed The App

This article is based on a true story. The names of the company and people involved were changed to protect the innocent 🙂 . A few weeks ago, we were contacted by a pretty big e-commerce company. We can’t really share their name but, for the purpose of this story, let’s call them “KubeCorp Inc”. They reached out to us following an edge-case incident they had, which resulted in severe downtime.

The Top 5 Kubernetes Configuration Mistakes-And How to Avoid Them

Let’s face it – Kubernetes can (and is) oftentimes very complex. This means that you’re bound to make a cluster configuration mistake along the way – apart from it impacting your cluster’s performance and security, it can also heavily affect your ability to enforce visibility and troubleshooting. There is, however, a light at the end of the tunnel.

Diving Under the Hood With Our New 'Node Status' Feature

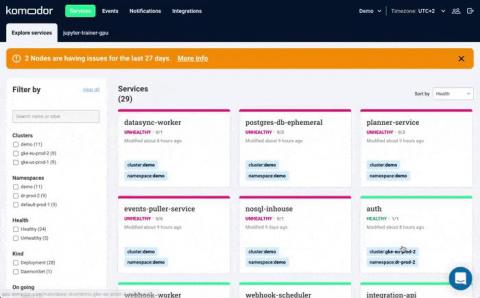
More than anything else, Kubernetes troubleshooting relies on the ability to quickly contextualize the problem with what’s happening in the rest of the cluster. As complicated as this may sound, SPEED is really the name of the game. After all, more often than not, you will be conducting your investigation under the glow of fires burning bright in production. Getting relevant context quickly and seeing things holistically is exactly what Komodor was created for.