Operations | Monitoring | ITSM | DevOps | Cloud

Dashboards

Build better PromQL queries with Grafana's metrics explorer

As more people and organizations adopt Prometheus and Grafana for observability, we at Grafana Labs want to make it easier for this expanding pool of users to answer questions about their systems, regardless of whether they’re experts or novices. That’s why we’re adding a feature to enhance metric browsing in the Prometheus query builder in addition to the metric select.

Watch Grafana 10 demos: New visualizations, plugin tools, and more from the latest Grafana release

With every major release of Grafana, we strive to give our users a broader, more powerful and more streamlined set of features for data visualization. Grafana 10, unveiled this month at GrafanaCON 2023, is certainly no exception. From more intuitive navigation to updated plugin development tools, Grafana 10 enhancements benefit new and seasoned users alike.

An inside look at how React powers Grafana's frontend

Grafana dashboards enable millions of users to visualize and analyze their data. And working behind the scenes of the widely used open source platform is React, a frontend JavaScript library for building user interfaces. In this post — which was inspired by my recent presentation at React Summit 2023 in Amsterdam — we’ll explore why we chose to use React for Grafana, and the benefits and challenges we’ve seen along the way.

Grafana k6 v0.45.0 release: gRPC streaming support, cloud script updates without running tests and more!

Grafana k6 v0.45.0 has been released, featuring a new experimental module for gRPC streaming support, a new browser recorder extension for Firefox and Chrome, and tons of improvements for Grafana k6 OSS and Grafana Cloud k6. Here’s a quick overview of the latest k6 release and all the news from the community.

The lowdown on Loki for log aggregation: 5 demos you don't want to miss

Looking to get started with log aggregation? Or perhaps take your logging game to a whole new, more advanced level? You’ve come to the right place. Grafana Loki is a key component of Grafana Labs’ open and composable Grafana LGTM stack (Loki for logs, Grafana for visualization, Tempo for traces, Mimir for metrics).

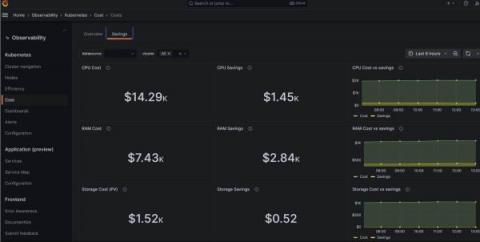
Rein in spending with Kubernetes cost monitoring in Grafana Cloud

As your Kubernetes infrastructure — and your business — grows, so too does the headache of managing your stack. And since controlling costs is crucial for your organization’s well-being, you need visibility into your complex system to ensure you’re spending your money wisely. That’s why we’re excited to introduce Kubernetes cost monitoring as a new feature in Grafana Cloud.

How to monitor an Apache CouchDB cluster with Grafana Cloud

We’re excited to introduce a dedicated Grafana Cloud integration for Apache CouchDB, a NoSQL document database that stores data in a JSON-based document format. Known for its scalability, availability, and easy replication of data across multiple servers, Apache CouchDB comes with a whole host of features designed to make it easy to run resilient distributed systems, with built-in bi-direcitonal replication allowing for simple replication across multiple servers and data centers.

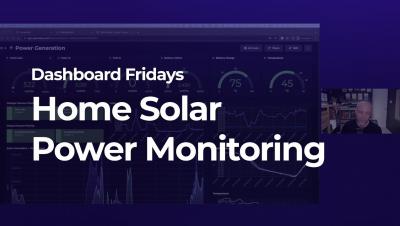
Dashboard Fridays: Home Solar Power Monitoring dashboard

In our latest Dashboard Fridays episode, Adam Kinniburgh showcases his Home Solar Power Monitoring dashboard built using SquaredUp and Amazon Timestream. This dashboard tracks the home energy system, which is monitored using Solar Assistant running on a Raspberry Pi in Adams garage. It shows how much solar power is being generated, how much energy is stored in the batteries, how much energy he's using, plus other metrics.