Grafana

New York, NY, USA
2014
  |  By Pepe Cano
Editor’s note: This blog post is the second in a series of posts about organizing your performance testing suite with Grafana k6. If you haven’t already, be sure to check out the first post in the series, which explores how to implement reusable test patterns and other best practices within your testing suite.
  |  By Peter Schretlen
Here at Grafana Labs, we have a long-standing commitment to helping our users understand how their applications and services behave from an external point of view. This critical practice — known as synthetic monitoring — has been a key focus of ours for nearly a decade. Back in 2015, we released worldPing, our first product to help measure the user experience and improve website performance.
  |  By Pepe Cano
In 2017, we open sourced Grafana k6 and made its first beta available to everyone. This wasn’t our first rodeo — k6 marked the third load testing tool our team had developed over a decade. We had recognized the gaps in existing solutions, as well as the barriers that were hindering adoption in the developer community. The plan was simple yet ambitious: let’s build a tool developers actually enjoy using and that helps engineering teams build more reliable software.
  |  By Joey Orlando, Raphael Batyrbaev
Sometimes, the little things can make a big difference. We’ve added a new feature in Grafana Incident & Response Management (IRM) that lets you sync your Google Calendar out-of-office events with Grafana OnCall.
  |  By Dominik Süß
When deploying an application using Kubernetes, you get used to all your resources being manageable by describing them to the Kubernetes API. Whether it’s deployments, secrets, configurations, or entire machines, everything exists as code somewhere. Introducing a cloud service into such an environment often means introducing additional ways to configure it, which can become cumbersome, given the rising number of cloud services modern applications depend on.
  |  By Kristin Knapp
“Okay,” said Bryan Boreham, distinguished engineer at Grafana Labs, as he took to the stage at GopherCon 2023 in September. “Who loves algorithms?” A room full of software engineers raised their hands in response — and with that, Bryan kicked off his talk at the annual event dedicated to the Go open source programming language. GopherCon 2023, which took place in San Diego, Calif.
  |  By Kristin Knapp
At this point, the technical and operational benefits of cloud computing are pretty much indisputable. But the cloud industry, as a whole, still has a long way to go in one critical area: sustainability. In fact, as shocking as it may sound, it’s estimated that cloud data centers have a greater carbon footprint than the entire aviation industry. Ida Fürjesová and Niki Manoledaki, both software engineers at Grafana Labs, are passionate about helping to change that.
  |  By Robert Magnusson
The Grafana OnCall mobile app is an essential tool for on-call engineers to monitor and respond to critical system events. Available for both iOS and Android, the app offers a range of features and notification settings that make the on-call experience easier and more intuitive — all in the palm of your hand.
  |  By Ishan Jain
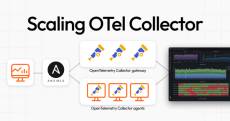
OpenTelemetry has emerged as a key open source tool in the observability space. And as organizations use it to manage more of their telemetry data, they also need to understand how to make it work across their various environments. This guide is focused on scaling the OpenTelemetry Collector deployment across various Linux hosts to function as both gateways and agents within your observability architecture.
  |  By Michelle Tan
We are consistently releasing helpful updates and fun features in Grafana Cloud, our fully managed observability platform powered by the open source Grafana LGTM Stack (Loki for logs, Grafana for visualization, Tempo for traces, and Mimir for metrics). This month is no exception.
  |  By Grafana
💡 Do you want to know what continuous profiling is and how flame graphs can help? Join Senior Developer Advocate Marie Cruz in this beginner-friendly tutorial to learn what profiling is and how a flame graph visualization works in Grafana.
  |  By Grafana
Grafana Cloud Synthetic Monitoring proactively monitors the performance of your APIs and web applications from the user's perspective. Powered by Grafana k6, Synthetic Monitoring combines GUI-based and as-code monitoring to improve efficiency, collaboration, and application reliability. Watch this demo of how to use Synthetic Monitoring in Grafana Cloud.
  |  By Grafana
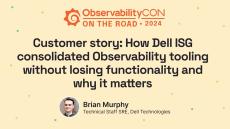
In this recorded session, Brian Murphy, Technical StafF SRE at Dell Technologies shares how his team, Dell ISG consolidated Observability tooling without losing functionality using Grafana Cloud. The ISG team own “Northstar Tooling” which consists of Artifactory, Github Enterprise, Jenkins, and more. They also They also manage the Internal Cloud and k8s clusters, as well as all the hardware and networking that goes with it.
  |  By Grafana
In this talk, D-EDGE Principal Engineer Clément Boudereau introduces you to Loki for logs, Tempo for traces, and Mimir for metrics by using two simple Java applications, OpenTelemetry, and Grafana dashboards. Helpful links:☁️ Grafana Cloud is the easiest way to get started with Grafana dashboards, metrics, logs, and traces. Our forever-free tier includes access to 10k metrics, 50GB logs, 50GB traces and more. We also have plans for every use case.
  |  By Grafana
💡 What is a candlestick and how can you visualize price movements in Grafana? Join Senior Developer Advocate Marie Cruz in this beginner-friendly tutorial to learn what candlesticks are and how to configure a candlestick visualization in Grafana.
  |  By Grafana
Have you just discovered Grafana Loki? Zero to Hero: Loki is a series of videos that aims to take you through the basics of ingesting, your logs into Grafana Loki an open-source log aggregation solution. In this episode, it's all about the structure of logs. In part 2 we cover the different ways a log can be formatted. ☁️ Grafana Cloud is the easiest way to get started with Grafana dashboards, metrics, logs, and traces. Our forever-free tier includes access to 10k metrics, 50GB logs, 50GB traces and more. We also have plans for every use case.
  |  By Grafana
💡 How is a heatmap different from a histogram visualization, and how do you configure one? Join Senior Developer Advocate Marie Cruz in this beginner-friendly tutorial to learn what heatmaps are and how to configure a heatmap visualization in Grafana.
  |  By Grafana
When using Grafana in a shared environment, managing users and permissions becomes necessary. Join Senior Developer Advocate, Lisa Jung to learn how! The following are covered in this episode: ☁️ Grafana Cloud is the easiest way to get started with Grafana dashboards, metrics, logs, and traces. Our forever-free tier includes access to 10k metrics, 50GB logs, 50GB traces and more.
  |  By Grafana
In this video, Grafana Developer Advocate Leandro Melendez describes the Geomaps panel visualization, they allow you to view and customize the world map using geospatial data. You can configure various overlay styles and map view settings to easily focus on the important location-based characteristics of the data.

Grafana provides a powerful and elegant way to create, explore, and share dashboards and data with your team and the world. Grafana is most commonly used for visualizing time series data for Internet infrastructure and application analytics but many use it in other domains including industrial sensors, home automation, weather, and process control.

Grafana has a robust plugin architecture built for extensibility. Visualize data from more than 40 data sources, including commercial databases and web vendors, and add new graph panels with rich data visualization options. There is built in support for many of the most popular time series data sources. It works with Graphite, Elasticsearch, Cloudwatch, Prometheus, InfluxDB and more.

Grafana Labs is the company behind Grafana, the leading open source software for visualizing time series data. Grafana Labs helps users get the most out of Grafana, enabling them to take control of their unified monitoring and avoid vendor lock in and the spiraling costs of closed solutions.