Operations | Monitoring | ITSM | DevOps | Cloud

Latest Videos

The Grafana Enterprise Stack in less than 3 minutes

Grafana Labs is the open & composable observability company. In just over 6 years, our namesake product, Grafana, has become the world's #1 dashboarding service for time series data with over 6 million users. And we've been recognized as a leader in the space. Grafana Labs has built the world's first open & composable observability stack -- and it's natively designed for monitoring hybrid-cloud, container, and microservices environments.

Correlate Your Metrics, Logs & Traces with the curated OSS observability stack from Grafana Labs

Correlation between metrics, logs, and traces should be as effortless as possible. This helps you make better decisions and actions. The Grafana Labs open-source observability stack enables powerful correlations between your metrics, log, and traces. The key here is to have consistent metadata across the three pillars of observability. Let me demo you how this works in this video.

Unify your data with Grafana, wherever it lives: The ElastiSpLoki dashboard

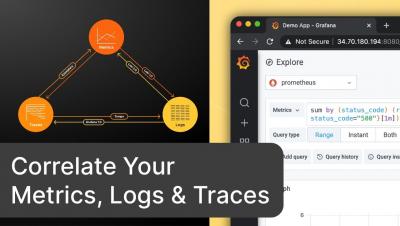
At Grafana Labs, we believe you should unify your data, not your database. We want to help you with your observability, not own it But what if you have multiple teams using multiple open source and commercial solutions? Not a problem. To give an example, here is a quick demo of Splunk, Elastic, and Loki logs combined into one UI in #Grafana This is more than a dashboard; it's a composite panel with transformations of all three sources Your teams should be able to use best-of-breed technologies rather than being locked into one

Effective troubleshooting with Grafana Loki - query basics

Loki doesn't index your logs, and that is a very different approach than popular full-text search engines like Elasticsearch or Solr That sounds like a huge constraint. How can you do powerful searches if you don't index the log lines? After this video, you now know how to use Loki's "filter" capability for forensic troubleshooting. Happy searching!

Grafana Loki sneak peek: Generate Ad-hoc metrics from your NGINX Logs

Get a sneak preview of a future version of Grafana Loki that enables you to generate ad-hoc metrics from your log data. This video features a Loki-based web analytics dashboard, which uses the access logs of the popular open-source web server NGINX. Every panel on this dashboard uses ad-hoc metrics created with Loki, well, besides the Log panel obviously. Would this be useful for your use-case? Let us know in the comments.