Operations | Monitoring | ITSM | DevOps | Cloud

Latest Videos

Dashboard Fridays: Sample SolarWinds Orion Nodes Dashboard

This SolarWinds Orion dashboard gives an overview of nodes alongside a summary of health, using the Web API and dashboard sharing capabilities of SquaredUp. Using the powerful Web API tile in SquaredUp, the SolarWinds dashboard connects to the SolarWinds Information Services REST API endpoint, using SQL queries in the request data, in real-time. Join Adam Kinniburgh and Customer Solutions Engineer Casey as they showcase how it was made, the challenges it solves, and their top tips for building it yourself.

Dashboard Fridays: Azure VM Health Dashboard

Adam is back for our final Dashboard Fridays video of 2021, and is joined by Azure expert and community hero Cameron Fuller of Catapult Systems! The Azure Management Services team at Catapult required a quick way to visualize the key health pieces for their customers, using a visually intuitive dashboard. In this bitesize video, Cameron will showcase this sample Azure VM Health dashboard focused on free disk space, heartbeat and CPU utilization. Tune in to learn how it was made, the challenges it solves, and how you can easily get your hands on it.

Azure Thames Valley: Azure CosmosDB as a Knowledge Graph (in SquaredUp's Cloud product)

In this session, Richard Jones, SquaredUp CTO, shares how SquaredUp's new Cloud product utilises Azure CosmosDB as a graph database, to provide an explorable and searchable knowledge graph of all your applications, services, and resources spanning all your tools and platforms.

Dashboard Fridays: Sample Zendesk Support Dashboard

Our Support Team wanted a real-time overview of all the cases currently in play so they could monitor multiple channels in one place. This dashboard gives the team a real-time view of their tickets by type, status, topic, and more! Join Adam Kinniburgh and our Customer Support Manager Mike Halfacree as they showcase this sample Zendesk dashboard - how it's made, who it's for, the challenges it solves and how you can easily replicate it!

Dashboard Fridays: Sample PagerDuty Alerting dashboard

Adam Kinniburgh is back with another Dashboard Fridays episode, this time joined by Ashley Thompson as they showcase this example PagerDuty Alerting dashboard. This dashboard gives an overview of alerting sent to PagerDuty from any source, even external sources like Pingdom.

Dashboard Fridays: Example SQL Samples Dashboard

Join SquaredUp's Adam Kinniburgh and fellow virtualisation expert Shawn Williams as they showcase this SQL Sample dashboard. This dashboard was designed to demonstrate how the same base SQL query could be used with each of SquaredUp’s visualizations. Each SQL visualization slightly modifies how the data is presented to target user requirements. Tune in to learn how it was made, the challenges it solves, and Shawn's top tips for building it yourself.

Dashboard Fridays: Sample Symantec Endpoint Protection (SEP) Dashboard

Join SquaredUp's Adam Kinniburgh and SCOM community hero Ruben Zimmermann as they showcase this example SEP Dashboard. Giving an overview of the status of the various endpoint protection systems, this dashboard is used by the IT team to keep on top of device security, and by the service desk to escalate appropriately.

Dashboard Fridays: Sample UptimeRobot Dashboard

Join Adam Kinniburgh and Ashley Thompson as they showcase this example UptimeRobot Dashboard. Built in SquaredUp with the powerful WebAPI tile, this dashboard gives an overview of monitoring configured using UptimeRobot’s website monitoring features. Query UptimeRobot for information about your web tests, summarize them, and create a slick UptimeRobot dashboard in SquaredUp. This is an example of querying the web test data, though the other data sets are equally easy to pull in!

Dashboard Fridays: Sample JIRA Health dashboard

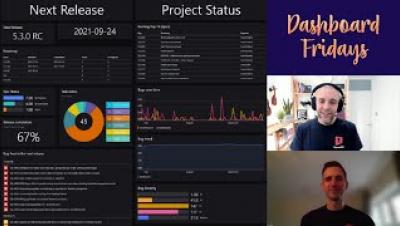
Join SquaredUp's Adam Kinniburgh and Tim Wheeler as they showcase this example Jira Health Status dashboard. Offering a quick view of the state of your next release, alongside the health of the Jira project as a whole, this dashboard uses SquaredUp’s Web API and PowerShell tiles to improve on Jira’s native dashboarding capabilities. Tune in to learn how it was made, the challenges it solves, and our top tips for building it yourself.