Operations | Monitoring | ITSM | DevOps | Cloud

Latest Posts

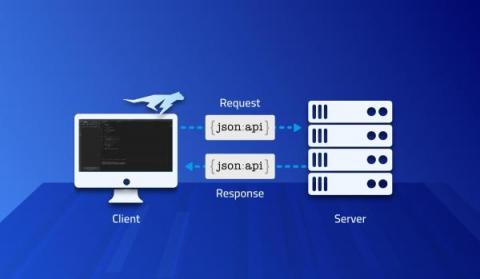
Debugging Gson, Moshi and Jackson JSON Frameworks in Production

Parsing bugs are the gift that keeps giving in the age of APIs. We use a service; it works perfectly in debugging, QA, etc. Then some user input that made its way to the web request, returns a result we just can’t parse. Unfortunately, there isn’t much we can do at this stage. We need to understand why the failure occurred and how we can workaround it and fix it.

Short and Exciting Journey of M1 Build Agent Configuration

Back in November 2020 Apple’s M1 chip was introduced and as the end users moved forward to M1 based Macs it became mandatory to build applications that are compatible with the new technology. The M1 chip has incredible improvements and features but I won’t cover them in this post.There are many resources on the internet covering this and I encourage you to explore them. In this post I will cover several challenges I tackled while setting up an M1 build.

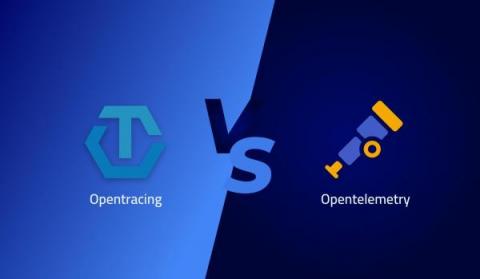
OpenTracing vs. OpenTelemetry

Monitoring and observability have increased with software applications moving from monolithic to distributed microservice architectures. While observability and application monitoring share similar definitions, they also have some differences. The purpose of both monitoring and observability is to find issues in an application. However, monitoring aims to capture already known issues and display them on a dashboard to understand their root cause and the time they occurred.

Understand Source Code - Deep into the Codebase, Locally and in Production

Say you have a new code base to study or picked up an open source project. You might be a seasoned developer for whom this is another project in a packed resume. Alternatively, you might be a junior engineer for whom this is the first “real” project. It doesn’t matter! With completely new source code repositories, we still know nothing… The seasoned senior might have a leg up in finding some things and recognizing patterns.

Spring Boot Performance Workshop with Vlad Mihalcea

A couple of weeks ago, we had a great time hosting the workshop you can see below with Vlad Mihalcea. It was loads of fun and I hope to do this again soon! In this workshop we focused on Spring Boot performance but most importantly on Hibernate performance, which is a common issue in production environments. It’s especially hard to track since issues related to data are often hard to perceive when debugging locally.

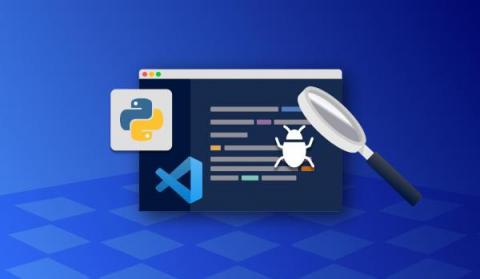
How to debug python in VSCode

Python has become one of the most popular programming languages globally and is particularly popular in data science and artificial intelligence. Python’s popularity can be attributed to its ease of use and readability and the large ecosystem of libraries and frameworks built around it. Python is also popular among developers working on cloud-based applications, as they can use it to orchestrate complex workflows.

Top 8 IntelliJ Debug Shortcuts

Let’s get real – as developers, we spend a significant amount of time staring at a screen and trying to figure out why our code isn’t working. According to Coralogix, there are an average of 70 bugs per 1000 lines of code. That’s a solid 7% worth of blimps, bumps, and bugs. In addition to this, fixing a bug can take 30 times longer than writing an actual line of code. But it doesn’t have to be this way.

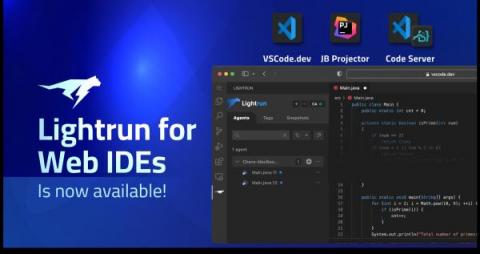
Lightrun Is Now Available For Web IDEs

We’re delighted to announce that Lightrun for Web IDEs is now available for our beta users! Lightrun for the Web is now supported in three different IDEs: If you want to check out the individual plugins, check out the respectable documentation articles: Lightrun’s users are now able to connect to their live applications directly from the browser, without having to download one of our dedicated plugins – and enjoy the full suite of Lightrun features right in the browser.

How to use VSCode to debug a Node.js application

Debugging is an essential step in software development, as it allows developers to fix errors before releasing the software to the public. Debugging tools can be integrated into code editors, making the debugging process more efficient. This tutorial will show you how to debug node.js in Visual Studio Code.

IllegalArgumentException in Java

Let’s look at IllegalArgumentException, which is one of the most common types of exceptions that Java developers deal with. We’ll see when and why IllegalArgumentException usually occurs, whether it’s a checked or unchecked exception, as well as how to catch and when to throw it. We’ll use a few examples based on common Java library methods to describe some of the ways to handle IllegalArgumentException.