Operations | Monitoring | ITSM | DevOps | Cloud

Latest Posts

Rapid Performance Analysis using Developer Tools

In the world of performance testing there is a heavy focus on the practice of load testing. This requires building complex automated test suites which simulate load on our services. But load testing is one of the most expensive, complicated, and time consuming activities you can do. It also generates substantial technical debt. Load testing has its time and place, but it's not the only way to measure performance.

DORA Metrics Considerations

DORA metrics, not to be confused with the beloved children’s cartoon character, are a bit trendy at the moment in the world of technology. The DevOps Research and Assessment group (DORA) is run out of Google. They run surveys and do research into what makes organizations successful in the Digital Age. They’re probably most well known for their yearly State of DevOps Reports and the book Accelerate.

Understand your Azure Active Directory Sign-Ins with KQL

When Azure AD is configured to record Sign-In activity, Kusto KQL can be used to gain valuable insights. This blog walks through common needs and shows how to visualize them in SquaredUp. Ruben Zimmermann is an Infrastructure Architect at a large manufacturing company who likes Azure, KQL, PowerShell and, still, SCOM.

Launching a new dashboarding experience

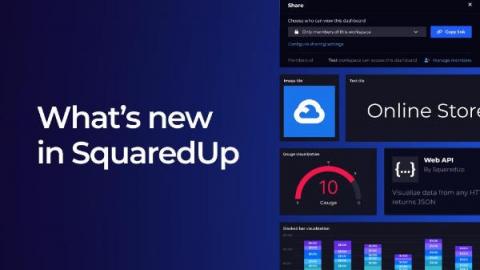
Since we launched the new SquaredUp last Fall, our focus has been making it easier than it’s ever been to connect to any data source, build beautiful dashboards, and share them with anyone. Today we’re excited to announce a fully redesigned dashboarding experience that does just that. The new dashboarding experience remains backed by data mesh technology, which means your data stays where it lives – it’s simply stitched together and available on-tap from the source.

Metrics vs. Logs vs. Traces (vs. Profiles)

In software observability, we often talk about three signal types - metrics, logs, and distributed traces. More recently I've been hearing about profiles as another signal type. In this article I will explain the different observability signals and when to use them in a clear and concise way.

Instrumenting Node.js code with Prometheus custom metrics

Automatic instrumentation is great, but to get the most out of your monitoring you often need to instrument your code. In this article I am going to explain how to instrument a Node.js express app with custom metrics using the Prometheus prom-client package. Although this article specifically addresses Node.js and express, my hope is that the general concepts are applicable to other languages too.