Operations | Monitoring | ITSM | DevOps | Cloud

May 2024

Kubernetes Monitoring - What to Monitor, Tools and Best Practices

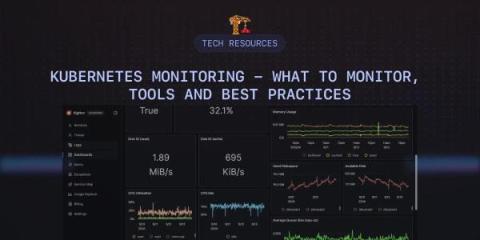
Kubernetes has since emerged as “THE” container orchestration platform for deploying and managing containerized workloads as a result of its robust capabilities. However, the complexity of its architecture and its dynamic nature present significant challenges in monitoring deployed workloads and the platform itself. Kubernetes monitoring is crucial for maintaining the health, performance, and reliability of containerized applications.

Kubernetes Logging | Set Up K8s Log Monitoring with OpenTelemetry

Kubernetes is a powerful orchestration tool for managing containers, but it comes with its own set of challenges. One of the biggest hurdles is effectively logging what's happening in your system. As your applications grow and spread across clusters, keeping track of their behavior becomes crucial. In this article, we will discuss logging in Kubernetes, common Kubernetes log types, and how logs can be effectively tracked and managed.

Using Kubectl Logs | Complete Guide to viewing Kubernetes Pod Logs

Information about the containers and pods on your cluster may be obtained using the kubectl logs command. These logs allow you to know the performance of your applications, whether they are failing or healthy, and are particularly useful for debugging and troubleshooting purposes. In this article, we will see how to use the kubectl logs command to get information from existing resources in a Kubernetes cluster. Before we dive in, let's first take a quick look Kubernetes architecture and logging.

Latest Top 11 Observability Tools in Spotlight - 2024's Guide

In microservices architecture, observability tools enable you to create central dashboards to gauge the health of your distributed systems. New age observability tools have shifted to providing quick workflows to debug application issues. In this post we will explore top 11 observability tools that you can consider to use for your software systems. In today's digital economy, distributed architectures have become the norm.

Kubectl Top Pod/Node | How to get & read resource utilization metrics of K8s?

Kubectl Top command can be used to retrieve snapshots of resource utilization of pods or nodes in your Kubernetes cluster. Resource utilization is an important thing to monitor for Kubernetes cluster owners. In order to monitor resource utilization, you can keep track of things like CPU, memory, and storage. In this article, we will see how to use kubectl Top command to get and read metrics about pods and nodes. We will also breakdown the output to understand what it means.

Kubectl Logs Tail | How to Tail Kubernetes Logs

The kubectl logs tail command is a tool that allows users to stream the logs of a pod in real-time while using Kubernetes. This command is particularly useful for debugging and monitoring applications, as it enables users to view log output as it is generated and quickly identify any issues or problems with their application. In this article, we will see how to use the kubectl logs tail command to stream logs, the benefits of using the command, and an advanced tool for streaming logs.

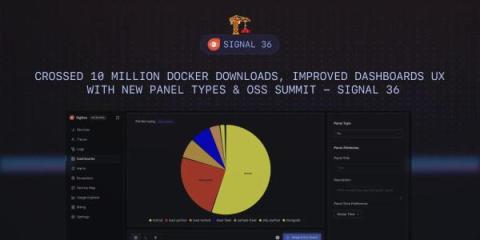
Crossed 10 Million Docker Downloads, Improved Dashboards UX with New Panel Types & OSS Summit - SigNal 36

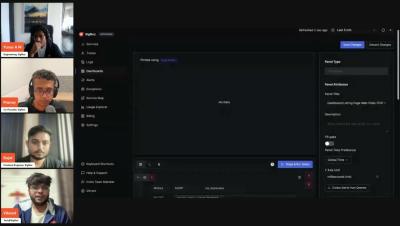
Welcome to SigNal 36, the 36th edition of our monthly product newsletter! We crossed 10 Million Docker downloads for our open source project. We’ve enhanced our Dashboards UX and incorporated feedback from users in different areas of our product. Let’s see what humans of SigNoz were up to in the month of April 2024.