Operations | Monitoring | ITSM | DevOps | Cloud

August 2018

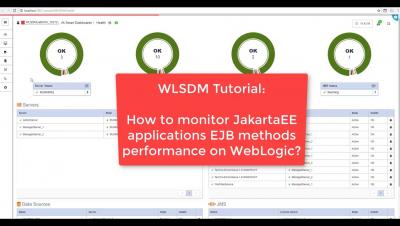
How to monitor JavaEE applications' EJB method performance on WebLogic?

Previously on WLSDM blog, we have learned about monitoring applications’ database statements (JDBC SQL) and performance on Oracle WebLogic server. In this blog post we have created another tutorial to learn how to monitor and diagnose WLSDM back-end EJB business method invocation events.

How to Monitor JavaEE Applications' EJB Method Performance on WebLogic?

WLSDM has back-end dashboards that offers monitoring EJB container. On WLSDM EJB dashboard you are able to view EJB Business Methods, its applications and method duration... etc. You can set alarm and configure EJB method duration threshold in "Monitoring & Diagnostics" page. You will be notified if EJB performance duration exceeds the threshold that you have defined.