Operations | Monitoring | ITSM | DevOps | Cloud

Monitoring

The latest News and Information on Monitoring for Websites, Applications, APIs, Infrastructure, and other technologies.

What is Synthetic Testing?

Synthetic testing, also referred to as continuous monitoring or synthetic monitoring, is a technique for identifying performance problems with critical user journeys and application endpoints before they impair the user experience. Businesses may use synthetic testing to assess the uptime of their services, application response times, and the efficiency of consumer transactions on a proactive basis.

Heartbeat Monitoring With Checkly

Today’s a big day at Checkly; we’re thrilled to announce that next to Browser and API checks we released a brand new check type to monitor your apps — say “Hello” to Heartbeat checks! In the realm of software, ensuring uninterrupted functionality is critical. While synthetic monitoring helps you discover user-facing problems early, keeping a close eye on the signals coming from your backend can be just as vital.

Comparing Datadog and New Relic's support for OpenTelemetry data

OpenTelemetry is the future of Observability, APM, Monitoring, whatever you want to call ‘the process of knowing what our software is doing.’ It’s becoming common knowledge that your time is better spent gaining experience with an open, standardized system for telemetry than closed-source or otherwise proprietary standard. This truth is so universally acknowledged that all the big players in the market have made announcements of how they’re embracing OpenTelemetry.

AWS KMS Use Cases, Features and Alternatives

A Key Management Service (KMS) is used to create and manage cryptographic keys and control their usage across various platforms and applications. If you are an AWS user, you must have heard of or used its managed Key Management Service called AWS KMS. This service allows users to manage keys across AWS services and hosted applications in a secure way.

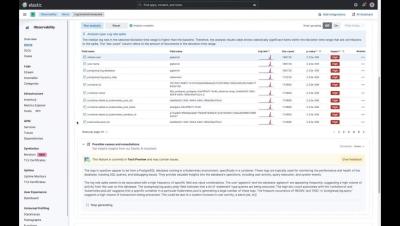
Elastic AI Assistant for Observability

Harness the power of generative AI to turn insights into actions. Powered by the Elasticsearch Relevance Engine™ (ESRE™), Elastic’s AI Assistant (in technical preview for Observability) transforms problem identification and resolution by eliminating manual data chasing across silos to an interactive assistant that delivers accurate and context-aware remediation for SREs.

Kubernetes Logging with Filebeat and Elasticsearch Part 1

This is the first post of a 2 part series where we will set up production-grade Kubernetes logging for applications deployed in the cluster and the cluster itself. We will be using Elasticsearch as the logging backend for this. The Elasticsearch setup will be extremely scalable and fault-tolerant. ‍

Announcing Sift: automated system checks for faster incident response times in Grafana Cloud

When faced with an incident, there are two areas that demand your immediate attention: the incident investigation, and the cross-functional coordination needed to resolve the issue. Grafana Incident helps with the collaboration by providing a central hub for communication across teams that seamlessly integrates with the tools you are already using, such as Slack or Microsoft Teams. But how can you best use your telemetry data to debug your application and bring your systems back online?

Kubernetes Logging with Filebeat and Elasticsearch Part 2

In this tutorial, we will learn about configuring Filebeat to run as a DaemonSet in our Kubernetes cluster in order to ship logs to the Elasticsearch backend. We are using Filebeat instead of FluentD or FluentBit because it is an extremely lightweight utility and has a first-class support for Kubernetes. It is best for production-level setups. This blog post is the second in a two-part series. The first post runs through the deployment architecture for the nodes and deploying Kibana and ES-HQ.