Operations | Monitoring | ITSM | DevOps | Cloud
Tracing
The latest News and Information on Distributed Tracing and related technologies.
OpenTelemetry best practices: A user's guide to getting started with OpenTelemetry
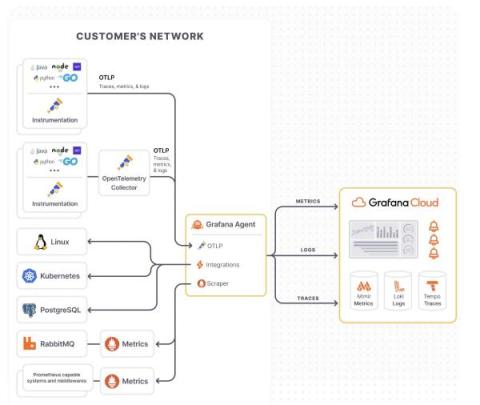
If you’ve landed on this blog, you’re likely either considering starting your OpenTelemetry journey or you are well on your way. As OpenTelemetry adoption has grown, not only within the observability community but also internally at Grafana Labs and among our users, we frequently get requests around how to best implement an OpenTelemetry strategy.
A Bright New Era in Developer Troubleshooting with Lumigo and OpenTelemetry
At Lumigo, building developer-first tools has always been at the forefront of our approach to troubleshooting and debugging. As developers ourselves, we have experienced firsthand the frustration and intricacies of sifting through logs looking for answers. We’ve also felt the pressure of the clock ticking, with production issues waiting to be resolved and the need for timely answers to surfaced application issues.
OpenTelemetry Overview
Monitoring distributed systems means collecting data from various sources, including servers, containers, and applications. In large organizations, this data distribution makes it harder to get a single view of the performance of their entire system. OpenTelemetry helps you streamline your full-stack observability efforts by giving you a single, universal format for collecting and sending telemetry data. Thus, OpenTelemetry makes improving performance and troubleshooting issues easier for teams.
Lumigo Releases 1-Click OpenTelemetry for Microservices Troubleshooting
Lumigo is excited to announce its microservice troubleshooting platform now provides developers and DevOps with the power of OpenTelemetry (OTel) with a single click. Lumigo has long been the leading troubleshooting platform for serverless, but now, users can harness its best-in-class debugging and observability platform for all microservices-based environments.
Using OpenTelemetry Collector Loki Receiver to Send Logs to SigNoz [Code Tutorial]
Monitor HAProxy Metrics and Logs with OpenTelemetry [Step By Step Guide]
Combining AWS and Prometheus with OpenTelemetry
In the realm of data and complex scenarios, we humans naturally gravitate towards visualizing things as entities with attributes, rather than just raw data. Consider the phrase, “The response time on our Ad Generation service has increased.” It immediately resonates with the audience supporting the service.


