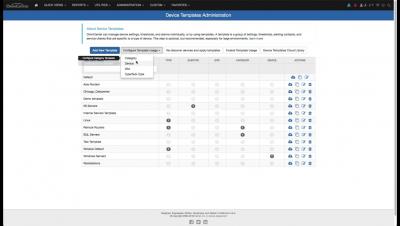
One of the greatest features of VirtualMetric is its realtime monitoring. You can monitor your servers and virtualization with less than a second interval. It is simple and easy! The realtime monitoring showcase all counters in a single chart to help you understand better the processes within your infrastructure and make a correlation between the data!
We’re excited to announce a highly requested new feature for Raygun Crash Reporting for our Business and Enterprise customers called 'Reports' This new feature allows you to construct your own custom reports based on the data and criteria that you’d like to see and segment. For example, if you release a new version of your website and would like to see a detailed view of the errors affecting end users, 'Reports' will allow you to get details quickly.
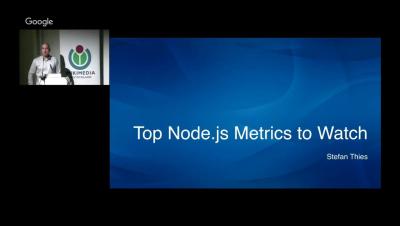
Stefan Thies talks about "Top Node.js Performance Metrics to watch“ including node.js key metrics, web framework metrics and examples from real applications. How to collect metrics (e.g. related npm packages) and challenges in monitoring node applications.
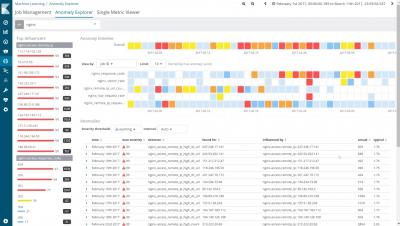
It Catches What You Might Miss, All by Itself. Complex, fast-moving datasets make it nearly impossible to spot infrastructure problems, intruders, or business issues as they happen using rules or humans looking at dashboards.