In this session, Itiel Shwartz will demonstrate common failure scenarios - both app and infra related. We will laugh a little and cry a little, and then cover monitoring, observability & troubleshooting best practices methodologies such as metrics, distributed tracing, logging, network visualization and more. But cheer up! We’ll wrap up by introducing some helpful tools, in order to find and fix issues as fast as possible.
What do modern incident analysis techniques and moving violations have in common? This Quick Bite tells the story of taking the same retrospective techniques the most innovative technology companies in the world use to understand their operational incidents... to traffic court, to help us all understand what really happened? What happened next? Come find out!
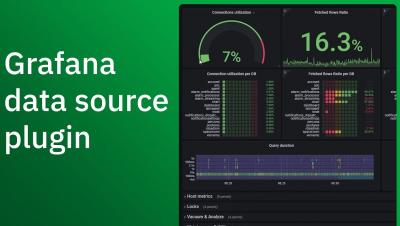
When Netdata's metric collection meets Grafana's visualization capabilities, you get powerful and dazzling dashboards to strengthen your monitoring infrastructure. Hugo Valente, Senior Product Manager, walks through the new plug-in to be sure that you're making the most of this unbeatable combination.
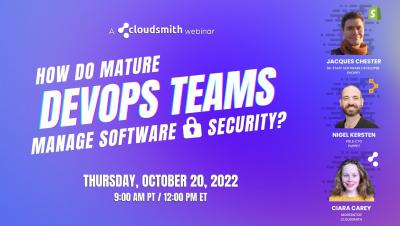
There is so much information out there about software security. Every day, there seems to be a new news headline, government regulation, or tool promising to “fix it all”. Do you ever wish you could just peek into how some of the industry’s best dev teams are managing this? We’ve assembled a panel of experts from the mature DevOps teams of Puppet and Shopify to answer some of your biggest questions.
Memfault is packed with features to help you monitor, debug and update your devices. But new tools, though exciting, can also be intimidating. If you’re new to Memfault or are unsure if you’re making the best possible use of all that the platform has to offer, watch this training session.
Learn how to find and fix BGP issues fast! Solutions Engineer Zach Henderson explains why BGP issues can damage your bottom line and then shows how to easily detect, analyze and resolve them with Catchpoint’s BGP Observability solution.
Komodor is a troubleshooting platform for Kubernetes, complete with automated playbooks for every K8s resource, and static-prevention monitors that enrich live & historical data with contextual insights to help enforce best practices and stop incidents in their tracks. By baking K8s expertise directly into the product, Komodor is accelerating response times, reducing MTTR and empowering dev teams to resolve issues efficiently and independently.
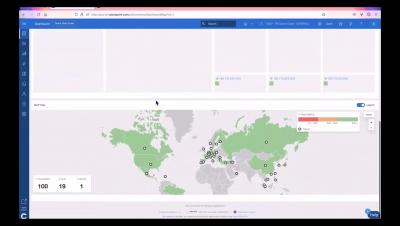
We briefly explain the starting point and how to download the plugin from the library directly from the Web Console, how to register the plugin and then the various existing parameters that can be used. Finally a plugin test is done with local MongoDB and hosted at Atlas to see the results obtained.
Every company running its applications on the cloud needs to estimate its operating costs, but running workloads on Kubernetes clusters across multiple providers often makes it hard. Without Kubernetes context in the cloud billing reports, users aren’t able to group costs or effectively assign the resources to the proper cost center. To address these gaps in Kubernetes cost monitoring, we are excited to announce Cost Advisor, a new feature in Sysdig Monitor that will give you visibility into Kubernetes costs and automatically help you identify areas to reduce them.