Android 13, the latest release from Google, is here. For IT administrators, this means making sense of new enterprise features and enhancements: what changed, why should you care – and most importantly, what should you do about it?
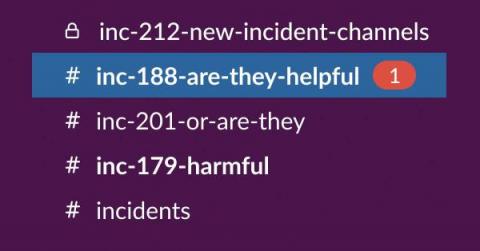
I caught the tail-end of a Twitter thread the other day which centred around the use of Slack channels for incidents, and whether creating a new channel for each new incident is helpful or harmful. It turns out this is a much more evocative subject than I thought, and since I have opinions I thought I’d share them!
On July 8 of 2022, the Canadian telecom company Rogers Communications suffered a major outage that impacted most of Canada for almost two days. This wasn’t completely unprecedented (they’d had an outage in 2021 that impacted their wireless servers for several hours) but the breadth and severity of this one is going to end up costing them far, far more than it seems at first glance.
Earlier this year, we announced that one of our goals for this year is to bring the UI of Oh Dear to the next level. Behind the scenes, our team is working hard on a complete rewrite of our marketing website and app. We're currently targeting the end of September timeframe to launch our redesign. In this blog post, we'd like to give you a preview of the redesign.
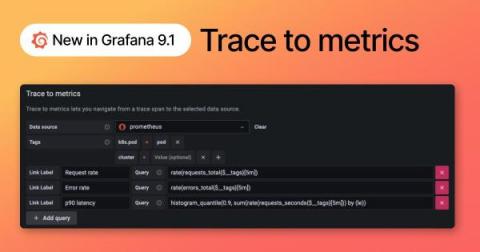
Traces, logs, and metrics provide inherently different views into a system, which is why correlating between them is important. With features like exemplar support, trace to logs, and span references, you can quickly jump between most telemetry signals in Grafana. With the release of Grafana 9.1, we’re improving Grafana’s ability to correlate different signals by adding the functionality to link between traces and metrics.
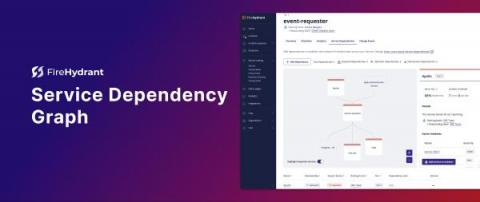
Understanding the impact and scope of an incident when degradation occurs is critical for returning your service online. This requires modeling the many downstream and upstream relationships between your services. Our new Service Dependency Graph provides a shortcut – a way to surface dependencies quickly, understand the relationship between services, and determine the scope or impact of an incident.
I’m a recent entrant to the Website Monitoring game, but there is one thing I realized straight away: A Monitoring tool is only as good as it’s configured to be. Website monitoring is at its best when it’s reliable, informative, and efficient. When it gives you the information you need, when you need it, and the peace of mind to say “if I’m not being alerted, I know it’s still working.”
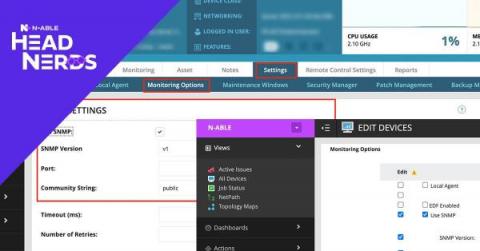
While it is fair to say that in recent years we’ve seen a shift to servers being deployed in the cloud through Microsoft Azure or AWS, I’m sure if you’re reading this today you still have a large percentage of physical servers under your management, including Hyper-V and ESXi hosts. N-central’s ESXi monitoring should automatically detect and monitor the hardware in these boxes, but what about the rest?