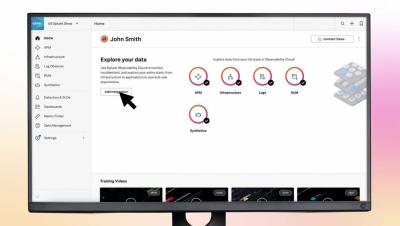
Operations | Monitoring | ITSM | DevOps | Cloud

Observability

The latest News and Information on Observabilty for complex systems and related technologies.

Why You Need Observability With the Splunk Platform

Splunk’s extensible and scalable data platform has been instrumental in helping ITOps teams fully understand their tech environments and tackle any IT use case with data streaming, dashboarding, federated search, AI/ML, and more. But, with the explosion of telemetry and the growing complexity of digital systems, ITOps practitioners who rely solely on a logging solution are missing out on critical insights from their digital systems.

5 reasons why observability and security work well together

Site reliability engineers (SREs) and security analysts — despite having very different roles — share a lot of the same goals. They both employ proactive monitoring and incident response strategies to identify and address potential issues before they become service impacting. They also both prioritize organizational stability and resilience, aiming to minimize downtime and disruptions.

Instrumenting a Demo App With OpenTelemetry and Honeycomb

A few days ago, I was in a meeting with a prospect who was just starting to try out OpenTelemetry. One of the things that they did was to create an observability demo project which contained an HTTP reverse proxy, a web frontend, three microservices, a database, and a message queue. Here’s a rough diagram: Their motivation was to try out OpenTelemetry and see how much effort it took for them to instrument their system.

Observability benefits of Cisco Catalyst Center integration

LogicMonitor’s agentless collection has long provided customers with many benefits for collecting telemetry data directly from network devices. Recently, LogicMonitor added another feature, enabling the discovery of devices/sites and the collection of telemetry data from the Cisco Catalyst Center. Retaining options is essential due to the pros and cons associated with each approach.

360° Observability: Enhancing Reliability Across the Board

As a manager, figuring out how to talk to your engineering teams about building a strong observability strategy can feel overwhelming. But don't worry! This post will help you navigate the challenges to unlock the full power of observability in your IT environment. Drawing on insights from over 40 discussions with larger enterprises, we've put together a strategy assessment that examines three key focus areas — what we’re calling aspects — each encompassing three actionable steps.

Getting started with the Elastic AI Assistant for Observability and Microsoft Azure OpenAI

Recently, Elastic announced the AI Assistant for Observability is now generally available for all Elastic users. The AI Assistant enables a new tool for Elastic Observability providing large language model (LLM) connected chat and contextual insights to explain errors and suggest remediation.

Observing Core Web Vitals with OpenTelemetry: Part Two

Core Web Vitals (CWV) are Google's preferred metrics for measuring the quality of the user experience for browser web apps. Currently, Core Web Vitals measure loading performance, interactivity, and visual stability. These are the main indicators of what a user’s experience will be while using a web page: Note: As of March 12th, INP has become a stable Core Web Vital, replacing First Input Delay (FID).