Operations | Monitoring | ITSM | DevOps | Cloud

Observability

The latest News and Information on Observabilty for complex systems and related technologies.

Observability benefits of Cisco Catalyst Center integration

LogicMonitor’s agentless collection has long provided customers with many benefits for collecting telemetry data directly from network devices. Recently, LogicMonitor added another feature, enabling the discovery of devices/sites and the collection of telemetry data from the Cisco Catalyst Center. Retaining options is essential due to the pros and cons associated with each approach.

360° Observability: Enhancing Reliability Across the Board

As a manager, figuring out how to talk to your engineering teams about building a strong observability strategy can feel overwhelming. But don't worry! This post will help you navigate the challenges to unlock the full power of observability in your IT environment. Drawing on insights from over 40 discussions with larger enterprises, we've put together a strategy assessment that examines three key focus areas — what we’re calling aspects — each encompassing three actionable steps.

Getting started with the Elastic AI Assistant for Observability and Microsoft Azure OpenAI

Recently, Elastic announced the AI Assistant for Observability is now generally available for all Elastic users. The AI Assistant enables a new tool for Elastic Observability providing large language model (LLM) connected chat and contextual insights to explain errors and suggest remediation.

Observing Core Web Vitals with OpenTelemetry: Part Two

Core Web Vitals (CWV) are Google's preferred metrics for measuring the quality of the user experience for browser web apps. Currently, Core Web Vitals measure loading performance, interactivity, and visual stability. These are the main indicators of what a user’s experience will be while using a web page: Note: As of March 12th, INP has become a stable Core Web Vital, replacing First Input Delay (FID).

How an APM Alternative Helps You Do Observability Right

Every software-driven business strives for optimum performance and user experience. Observability—which allows engineering and IT Ops teams to understand the internal state of their cloud applications and infrastructure based on available telemetry data —has emerged as a crucial practice to help engage this process. For years, application performance monitoring (APM) was the de facto practice and tooling that organizations have used to keep tabs on their critical systems.

Optimizing Operations: A Look At Observability For Manufacturers

As the automation of processes and deployment becomes more prevalent in the manufacturing industry, the need for IT services grows further. The use of complex systems and technologies, such as AI and robotics has become the new normal for manufacturing organizations.

Beyond the trace: Pinpointing performance culprits with continuous profiling and distributed tracing correlation

Observability goes beyond monitoring; it's about truly understanding your system. To achieve this comprehensive view, practitioners need a unified observability solution that natively combines insights from metrics, logs, traces, and crucially, continuous profiling. While metrics, logs, and traces offer valuable insights, they can't answer the all-important "why." Continuous profiling signals act as a magnifying glass, providing granular code visibility into the system's hidden complexities.

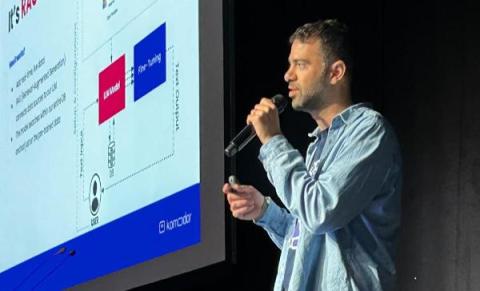
Do We Still Need to "Observe"? The Future of AI & O11y

AI has had a massive impact on every part of our lives, but mainly on how we consume large data sets easily. The observability world is based on collecting enormous amounts of data and consuming it by observing dashboards built on monitoring tools. Most of the o11y tasks like writing complex queries, creating dashboards & defining alerts, have been done much in the same way for the last decade & AI models are well-positioned to disrupt this modus operandi.