Operations | Monitoring | ITSM | DevOps | Cloud

Monitoring

The latest News and Information on Monitoring for Websites, Applications, APIs, Infrastructure, and other technologies.

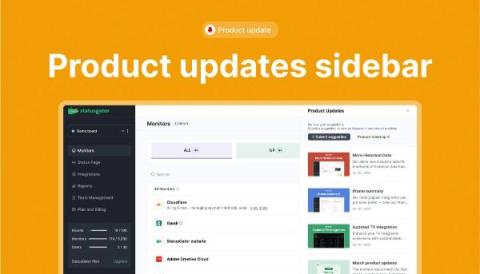
Product updates sidebar is here!

We’re excited to share a handy new update that’s all about keeping you informed: the Product Updates Sidebar. StatusGator is moving fast and investing heavily in our product. Staying informed about the latest tweaks and improvements just got a whole lot easier. Our new sidebar feature puts all the updates right at your fingertips, so you can stay in the know without breaking a sweat. Curious about what’s been changed or fixed? Our detailed changelog has you covered.

Detect and score application vulnerabilities

With AppDynamics and Cisco Secure Application, you can quickly identify where application vulnerabilities exist and gain insights as to how best to remediate them based on business risk observability. Let technology work for you by keeping up with the most recent vulnerabilities and help you prioritize what to remediate based on business risk.

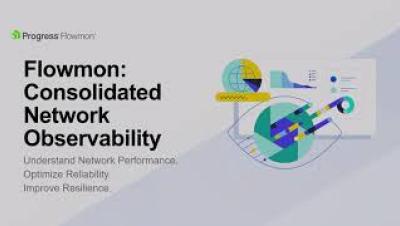
Flowmon Network Performance Monitoring

Flowmon is like having an AI-powered network security analyst joining your team, tirelessly monitoring your network 24/7, analysing traffic patterns and identifying potential threats in real time to help alert you in early attack stages. The solution distils thousands of alerts into a few security incidents intelligently prioritises critical events, providing real-time insights and actionable intelligence for shortening the time to investigate attacks and automate response.

Protecting Public Health: Strategies for Handling Legionella Outbreaks

Legionella bacteria pose an immediate and serious threat to public health when present in water systems, potentially leading to Legionnaires' disease - an extreme form of pneumonia caused by being exposed to Legionella bacteria. Therefore, effective outbreak management must take place. One key preventive measure used by officials to safeguard their citizens includes legionella water sampling which allows early detection of potential outbreaks within water networks.

How to monitor Apache web server performance metrics

Apache, the world’s most popular web server software, powers an estimated 30.2% of all active websites. Known for its reliability, flexibility, and robust features, Apache has been the backbone of the internet for decades. From small personal blogs to large-scale e-commerce platforms, Apache’s versatility allows it to handle a wide range of web applications with ease.

Kubernetes - From chaos to insights with AI-driven correlation of Logs and Metrics

Written by John Stimmel, Principal Cloud Specialist Account Executive, LogicMonitor It’s common knowledge that Kubernetes (commonly referred to as “K8”s) container management and orchestration provide business value by enabling cloud-native agility and superior customer experiences. By their nature, the speed and agility of Kubernetes platforms come with complexity.

Optimizing cloud resource costs with Elastic Observability and Tines

In today's cloud-centric landscape, managing and optimizing cloud resources efficiently is paramount for cloud engineers striving to balance performance and cost-effectiveness. By leveraging solutions like Tines and Elastic, cloud engineering teams can streamline operations and drive significant cost savings while maintaining optimal performance.

Measuring Node.js Performance in Production with Performance Hooks

In the first part of this series, we toured performance APIs in Node.js. We discussed the capabilities of APIs and how they can diagnose slowdowns or network issues in your Node application. Now, in this concluding segment, we will embark on a practical journey, applying these performance hooks in a real-world scenario. You will understand how to effectively use these tools to monitor and enhance your application's performance. Let's dive in and see these concepts in action!