Operations | Monitoring | ITSM | DevOps | Cloud

Latest Posts

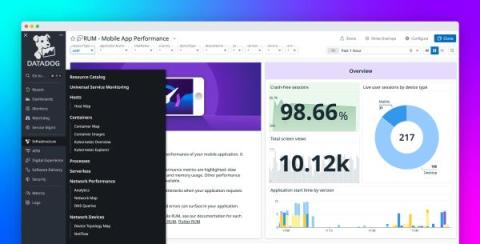
A closer look at our navigation redesign

Helping our users gain end-to-end visibility into their systems is key to the Datadog platform— to achieve this, we offer over 20 products and more than 700 integrations. However, with an ever-expanding, increasingly diverse catalog, it’s more important than ever that users have clear paths for quickly finding what they need.

Recapping Datadog Summit London 2024

In the last week of March 2024, Datadog hosted its latest Datadog Summit in London to celebrate our community. As Jeremy Garcia, Datadog’s VP of Technical Community and Open Source, mentioned during his welcome remarks, London is the first city that has seen two Datadog Summits, with the first one in 2018. It was great to be able to see how our community there has grown over the past six years.

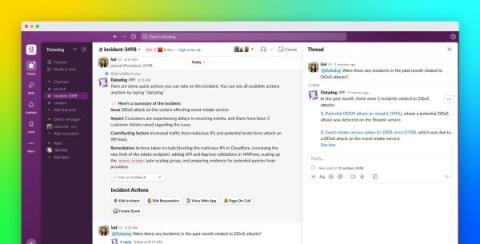
Stay up to date on the latest incidents with Bits AI

Since the release of ChatGPT, there’s been growing excitement about the potential of generative AI—a class of artificial intelligence trained on pre-existing datasets to generate text, images, videos, and other media—to transform global businesses. Last year, we released our own generative AI-powered DevOps copilot called Bits AI in private beta. Bits AI provides a conversational UI to explore observability data using natural language.

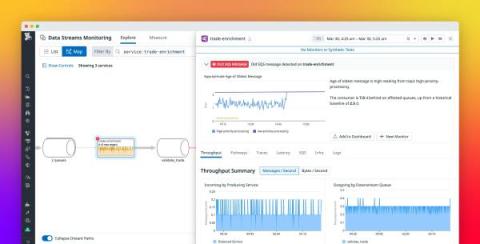
Monitor SQS with Data Streams Monitoring

Datadog Data Streams Monitoring (DSM) provides detailed visibility into your event-driven applications and streaming data pipelines, letting you easily track and improve performance. We’ve covered DSM for Kafka and RabbitMQ users previously on our blog. In this post, we’ll guide you through using DSM to monitor applications built with Amazon Simple Queue Service (SQS).

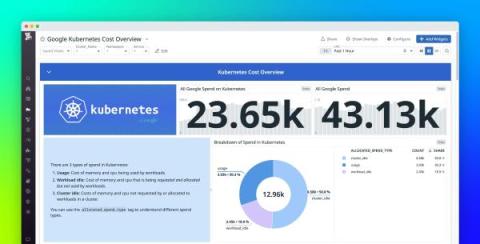
Empower engineers to take ownership of Google Cloud costs with Datadog

Google Cloud provides a wide range of services and tools to help engineering teams reduce the complexity of migrating and deploying applications in the cloud. As engineering teams work to improve the performance, reliability, and security of their applications, they also need to be conscious of cloud costs. But engineers often don’t have access to cost data, or they only see cost data in monthly reports.

Filter and correlate logs dynamically using Subqueries

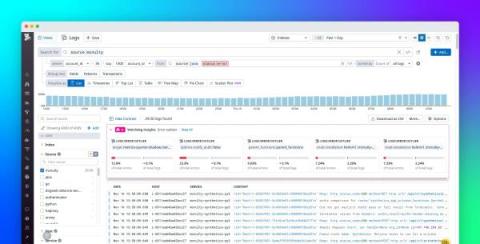
Logs provide valuable information that can help you troubleshoot performance issues, track usage patterns, and conduct security audits. To derive actionable insights from log sources and facilitate thorough investigations, Datadog Log Management provides an easy-to-use query editor that enables you to group logs into patterns with a single click or perform reference table lookups on-the-fly for in-depth analysis.

Best practices for monitoring software testing in CI/CD

A key challenge of monitoring your CI/CD system is understanding how to optimize your workflows and create best practices that help you minimize pipeline slowdowns and better respond to CI issues. In addition to monitoring CI pipelines and their underlying infrastructure, your organization also needs to cultivate effective relationships between platform and development teams.

Fine-tune observability configurations for all your Azure integrations in one place

Microsoft Azure provides an array of managed services to support many aspects of cloud computing, including application development, workload migration, and data management. To help you monitor the health and performance of these services, Datadog offers integrations with more than 40 Azure services, including Azure Kubernetes Service (AKS), Cosmos DB, and Azure App Services. Each integration provides robust data visualizations, meaningful alerts, and one-click Datadog Agent deployment.

Best practices for end-to-end service ownership with Datadog Service Catalog

In order to grow your organization effectively, you need to ensure the scalability of your systems. In a broad, distributed architecture, critical processes like incident triage, security response, and large-scale configuration changes can be difficult to execute without a programmatically accessible registry of what’s running in production and who owns it.

Simplify production debugging with Datadog Exception Replay

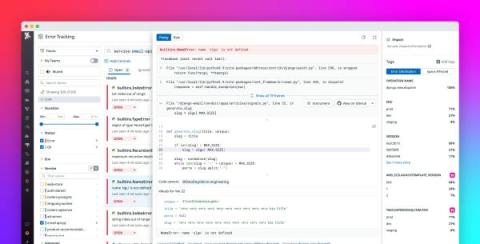
Debugging errors in production environments can frustrate your team and disrupt your development cycle. Once error tracking detects an exception, you then need to identify which specific line of code or module is responsible for the error. Without access to the inputs and associated states that caused the errors, reproducing them to find the root cause and a solution can be a lengthy and challenging process.