Operations | Monitoring | ITSM | DevOps | Cloud

March 2020

Percentile Aggregation with Histograms and CAQL

Percentiles are commonly used for measuring statistics, particularly when analyzing things like latency. Unfortunately, people frequently get tripped up when they want to take multiple percentiles and aggregate them. For example, let’s say we are monitoring a set of ten web servers and we want to collect latency statistics across all of them.

Circonus Dark Mode Is Here

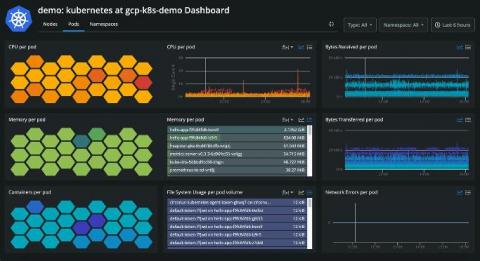
Today we want to talk about a welcome change to Circonus’ user interface: the addition of dark mode. Once found only in apps themselves, dark mode is now supported by all major operating systems, including MacOS, Windows 10, Android and iOS. And it’s also well-liked, with some tech sites finding that over 90% of their audience use dark mode some or all of the time.

High Frequency Data Analytics - The Final Frontier for Oil and Gas Production?

At Circonus, we love demanding and challenging use cases. We love working with companies in industries where getting it right is mission critical. Where the ability to harness and analyze vast amounts of data in real-time is critical to success and where good enough just isn’t good enough. There is perhaps no better example than the oil and gas industry where the industrial era is entering the digital era unleashing both challenges and enormous opportunities.

Circonus Sees Accelerated Rise in Global Infrastructure Monitoring and IoT Deployments

Today we are excited to announce and share the significant momentum we’ve seen here at Circonus for the start of 2020, as more enterprises seek out machine data intelligence solutions that can underpin their digital transformation initiatives. At the end of 2019, we launched our machine data intelligence platform, which enables enterprises to collect, store, and analyze vast amounts of data from sensors, systems and connected devices to gain extraordinary business insight and intelligence.