Operations | Monitoring | ITSM | DevOps | Cloud

December 2019

How to Monitor Cloud Migration and Data Transfer

Cloud migration is more than just a buzzword. According to several reports released at the beginning of 2019, almost 70% of enterprise organizations are moving their applications and infrastructure from local, self-managed hardware to one of the big cloud providers. Multiple case studies have been written about companies like Spotify, Dropbox, Gitlab, and Waze, all of which have replaced their core business infrastructures with cloud data centers.

Prometheus and Grafana: A Match Made in Heaven?

Prometheus and Grafana are two monitoring tools that, when combined, provide all of the information DevOps and Dev teams need to build and maintain applications. Prometheus collects many types of metrics from almost every variety of service written in any development language, and Grafana effectively queries, visualizes, and processes these metrics.

Using Logz.io for Spring Boot Logs

We recently wrote a blog with Julien Dubois, a Java Developer Advocate from Microsoft, on how to simplify logging for Spring Boot applications. This is a small preview. Spring Boot is an open source Java framework that makes it easier for developers to create microservices. Azure just announced Azure Spring Cloud, which will help Java engineers on Azure developer Java microservices faster. This blog explores how to simplify logging for Spring Boot applications.

Simplified Monitoring for AKS Deployments with Logz io

To deliver reliable, performant, and secure microservices on AKS, DevOps teams must be prepared to identify and fix production issues before they impact customer experiences. However, considering the scale and variety of log data generated by modern AKS deployments, gaining observability into AKS and the applications it powers is a significant data analytics challenge.

What Is a Service Mesh, and Why Do You Need One?

“Service mesh” is an umbrella term for products that seek to solve the problems that microservices’ architectures create. These challenges include security, network traffic control, and application telemetry. The resolution of these challenges can be achieved by decoupling your application at layer five of the network stack, which is one definition of what service meshes do.

Featured Post

7 Misconceptions of DevOps Debunked

There's no shortage of posts explaining what DevOps is - from articles that use acronyms like CALMS (Culture, Automation, Learning, Measurement and Sharing) to more thorough explanations that use the traditional division of business change analysis into "people, process, and tools." But there's another way to answer the question, "What is DevOps?" by defining not what DevOps is, but rather about what DevOps is not.

Getting Started with Kubernetes using MicroK8s

Single-node deployments of Kubernetes are more common than what one would expect. In some scenarios, single-node clusters make much more sense. For development purposes or testing, there’s no need to deploy a full-blown production-grade cluster. Single-node deployments are also handy for appliances and IoT applications since they have a much smaller footprint. Enter MicroK8s, a tool by Canonical that enables you to easily deploy a lightweight single-node cluster in your local environment.

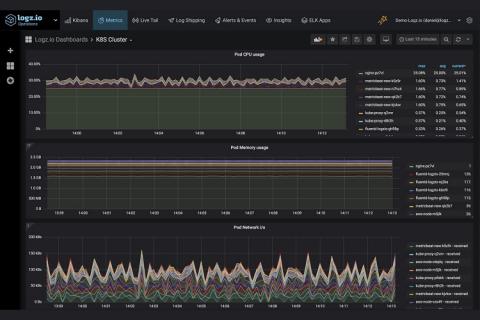
Kubernetes Observability with Logs and Metrics in Logz.io

Yesterday, we announced the beta release of Logz.io Infrastructure Monitoring — our Grafana-based monitoring solution, and the planned release of a Jaeger-based tracing solution. These additions to our platform complement our ELK-based Log Management product, together constituting what is the world’s only open source-based observability platform for monitoring, troubleshooting and securing distributed cloud workloads.

Unleashing a Better Open Source: Introducing Logz.io Cloud Observability Platform

Today, I am proud to announce the release of Logz.io Infrastructure Monitoring, a Grafana-based monitoring solution that enables engineers to speed up detection and reduce time to resolution. This new offering extends our Log Management and Cloud Security (Cloud SIEM) products, which together form Logz.io’s new Cloud Observability Platform.

Logz.io Enhancements and Changes with Kibana 7

We are happy to inform you that we are upgrading our user interface to support Kibana 7 for Logz.io! Kibana 7 offers users a long list of UI and UX enhancements that will make monitoring and troubleshooting your environment a much simpler and nicer experience. These enhancements include a cross-app dark theme, a new time picker, new filtering, a better dashboarding experience, and most importantly – a significant boost in performance. Shall we take a closer look?