Operations | Monitoring | ITSM | DevOps | Cloud

November 2019

Grafana Templates for Elasticsearch, Prometheus and InfluxDB

Grafana is everywhere. Almost every DevOps team out there is currently in the process of creating a proof of concept enabling them to implement Grafana into their stack—if they have not already implemented it, that is. Teams are eager to employ Grafana’s highly effective visualizations and dashboards that monitor and track services’ functionality and performance.

A Breakdown of Language Analyzers for Elasticsearch

Any search engine needs to be be able to parse language. As the field of natural language processing (NLP) has grown, specific text analysis has been applied to stop words and tokenizing (or marking) them by part of speech. In Elasticsearch (and elsewhere), the most attention has been paid to English, although the ELK stack has built-in support for 34 languages as of this writing.

14 Kibana Plugins to Spice Up Your Data Visualizations

Kibana is a powerful visualization platform designed specifically for log management with Elasticsearch. It already provides a lot built-in, but its open-source nature obviously lends it to some pretty cool simple and complicated additions from its community of devs. Some favorites include adding certain kinds of visualizations, API attachments, better integration between Kibana and other platforms, as well simple add-ons for flair in reports.

Speeding Up Security Investigation with Logz.io Threat Intelligence

Cloud, microservices, Kubernetes — all these bleeding-edge technologies revolutionizing the way applications are built and deployed are also a huge security headache. Modern IT environments are increasingly comprised of more and more components and layers, each of generating growing amounts of data. In most organizations, more data is a double-edged sword. On the one hand, it gives teams more visibility into their environment.

Logging Kubernetes on AKS with the ELK Stack and Logz.io

Hosted Kubernetes services such as AKS were introduced to help engineers deal with the complexity involved in deploying and managing Kubernetes clusters. They do not cover, however, the task of monitoring Kubernetes and the services running on it. While some of the hosted Kubernetes services offer logging solutions, they do not offer all the functionality, flexibility and user-experience expected from a modern log management solution.

Introducing Logz.io on the Azure Marketplace

The Azure Marketplace makes it easy for customers to identify, subscribe to, then use SaaS and API solutions by removing barriers in the procurement process for purchasing those products. By using the existing payment terms they have with Microsoft, Azure customers can click through a simple workflow to purchase an ISV solution without needing to negotiate new terms or speak directly with an Azure or ISV representative.

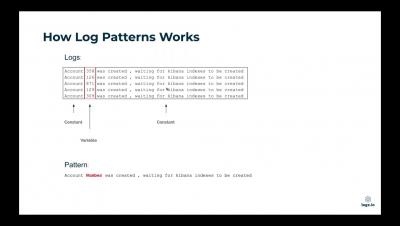
Troubleshooting On Steroids with Logz.io Log Patterns

It’s 3 AM and your phone is ringing. Rubbing your eyes, you take a look at the alert you just got from PagerDuty. A critical service has just gone offline. Angry customers are calling support. Your boss is on the phone, demanding the issue be resolved ASAP. You open up your log management tool only to be faced by 5 million log messages. What now?

Logz.io for MSPs: Fast, Powerful Log Analytics Improves Customer Success

Managed Service Providers (MSPs) are on the hook to deliver reliable, performant, and secure services to their customers. Production issues or security incidents can threaten SLAs, customer contracts, and ultimately business reputations. To state the obvious, MSPs need to understand what is going on in their environment so they can effectively identify and diagnose production issues before they impact customers. This is the idea behind “observability.”